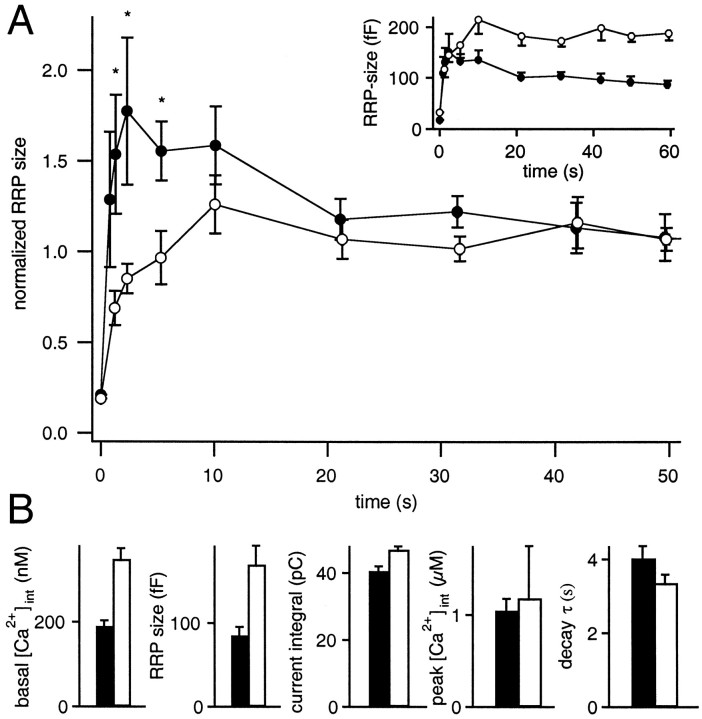
Fig. 5.
Refill kinetics at low and high basal [Ca2+]. A, Cells with low basal [Ca2+] (mean 189 ± 14 nm, ●) display a very prominent overshoot of the pool size shortly after the stimulus. The values marked with asterisks (at 1, 2, and 5 sec) are significantly different (p < 0.05) from both the steady-state values and the respective values at higher basal [Ca2+] (mean 348 ± 25 nm, n = 4, ○). Both populations displayed similar depletion levels as indicated bySint. The inset shows the rundown-corrected capacitance responses in absolute values. Note that the responses attained within the first 2 sec after depletion were comparable in both data sets. At high basal [Ca2+], however, the pool size continued to rise to the much larger steady-state size. B, RRP size and properties of the Ca2+ signal for cells with low and high basal [Ca2+] (189 nm,black bars; 348 nm, white bars).

