
Figure 4.
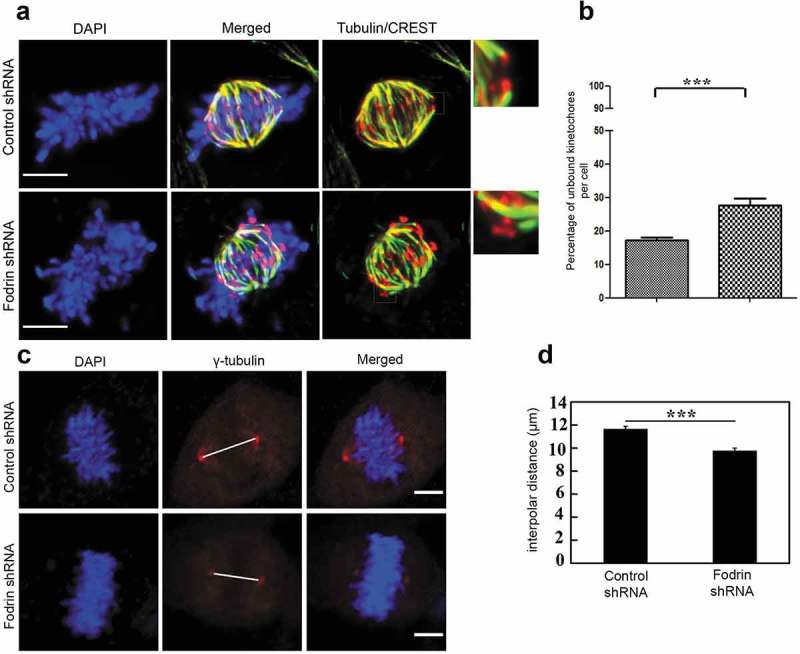
Depletion of α-fodrin hampers microtubule kinetochore attachment. (a) Immunostaining for tubulin and CREST using 100X objective of Zeiss epifluorescence microscope to determine the microtubule bound kinetochores. The smaller panels in the right side show the zoomed in images of the square boxes of microtubule bound kinetochore in case of control and microtubule unbound kinetochore in case of fodrin-depleted cells. (b) Graph depicting increased percentage of microtubule unbound kinetochore in fodrin downregulated U-251 MG cells. N = 14 for control, N = 15 for fodrin-depleted cells. (c) Immunofluorescence imaging of γ-tubulin in control cells and fodrin shRNA-treated cells to determine interpolar distance. The length of the line between the two centrosomes was considered as the spindle length. (d) Interpolar distance was calculated between the two centrosomes stained by γ-tubulin and measured using ImageJ. N = 50. shRNA treatment conditions are same as in Figure 2. All experiments were repeated thrice. *** stands for p ≤ 0.001. Scale bar represents 5 μm.