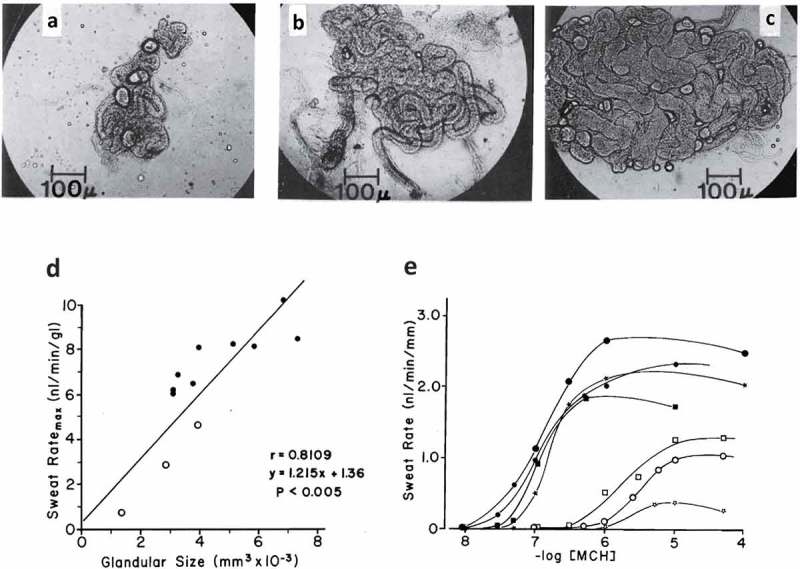
Figure 4.

Top row (panels A-C): Variation in the size of human eccrine sweat glands taken from the backs of three different men who were described as poor (A), moderate (B), and heavy sweaters (C). Bottom row: Correlation between size of sweat gland and sweat ratemax per gland (panel D). Dose-response curves (expressed per unit length of tubule) of sweat rates of 7 men to methacholine. Closed symbols show moderate to heavy sweaters. Open symbols show poor sweaters. Reprinted from Sato and Sato 1983 [131]with permission.
