
Figure 4.
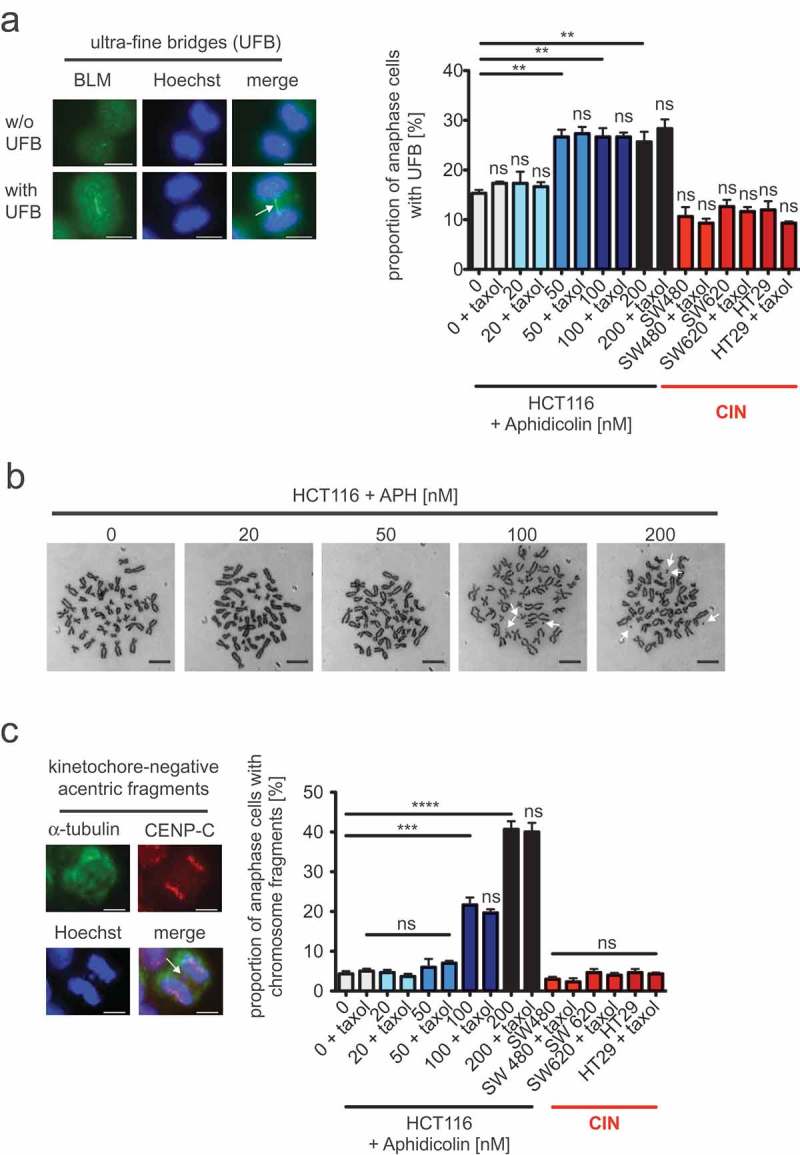
Mild replication stress-triggered abnormal microtubule growth rates neither influence the formation of ultra-fine anaphase bridges nor the generation of acentric chromosome fragments.
(a) Detection and quantification of cells exhibiting BLM-positive ultra-fine bridges. HCT116 cells were treated with increasing concentrations of aphidicolin for 16 hours before fixing and detecting ultra-fine bridges (arrow) using anti-BLM immunofluorescence (green) microscopy. Chromosomes were stained with Hoechst (blue). Representative examples of a cell with and without ultra-fine bridges are shown (scale bar, 7.5 µm). The proportion of cells exhibiting ultra-fine bridges were quantified and the graph shows mean values ± SEM (n = 300 anaphase cells from 3 independent experiments, t-test). (b) Examples of metaphase chromosome spreads from HCT116 cells treated with increasing concentrations of aphidicolin for 24 hours. Treated cells were arrested in mitosis and trypan-blue stained chromosome spreads were used to detect chromosome fragments as indicated by arrows. Representative examples are shown (scale bar, 10 µm). (c) Detection and quantification of anaphase cells exhibiting acentric chromosome fragments. HCT116 cells were treated with increasing concentrations of aphidicolin for 24 hours and acentric chromosome fragments were detected by immunofluorescence microscopy (chromosomes, Hoechst, blue; spindle, anti-alpha-tubulin, green; kinetochores, anti-CenpC, red; scale bar, 7.5 µm). A representative example of a cell with a kinetochore-negative chromosome fragment (arrow) is shown. Only kinetochore-negative chromosomes were quantified as acentric fragments and the graph shows the proportion of cells with acentric fragments (mean values ± SEM, n = 300 anaphase cells from 3 independent experiments, t-test).