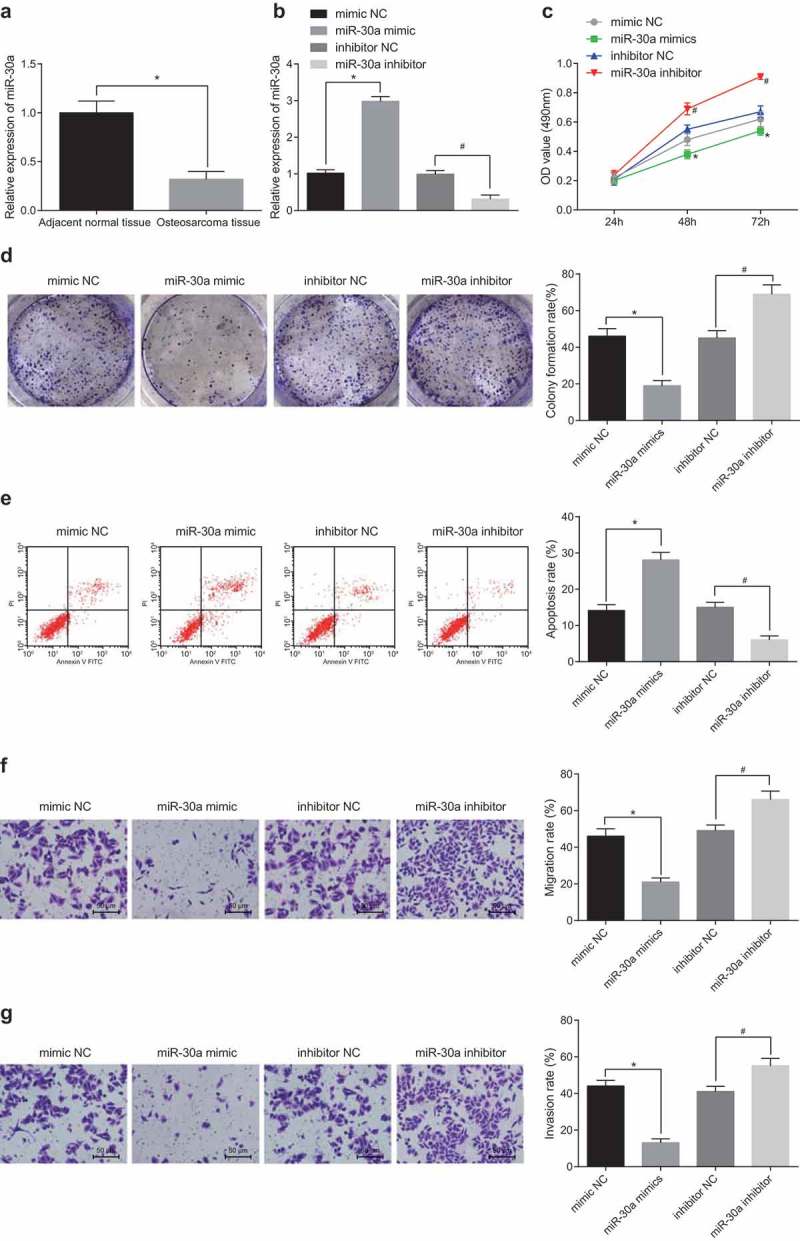
Figure 4.

MiR-30a overexpression restrains the proliferation, migration and invasion and contributes to the apoptosis of OS cells. (a) Detection of miR-30a expression in OS tissues and adjacent normal tissues by RT-qPCR; (b) Detection of miR-30a expression in U-2OS cells by RT-qPCR; (c) Detection of cell viability by MTT assay; (d) Detection of cell colony formation rate by colony formation assay; (e) Detection of apoptosis in each group by flow cytometry; (f) Detection of cell migration rate in each group by Transwell assay; (g) Detection of cell invasion in each group by Transwell assay; * P < 0.05 vs the mimic-NC group; #, P < 0.05 vs the inhibitor-NC group; the data were all measurement data and expressed as mean ± standard deviation; independent sample t test was used for statistical analysis between two groups, and one-way ANOVA for the comparison among multiple groups, followed by Tukey’s post hoc test; the experiment was repeated three times.
