
Figure 6:
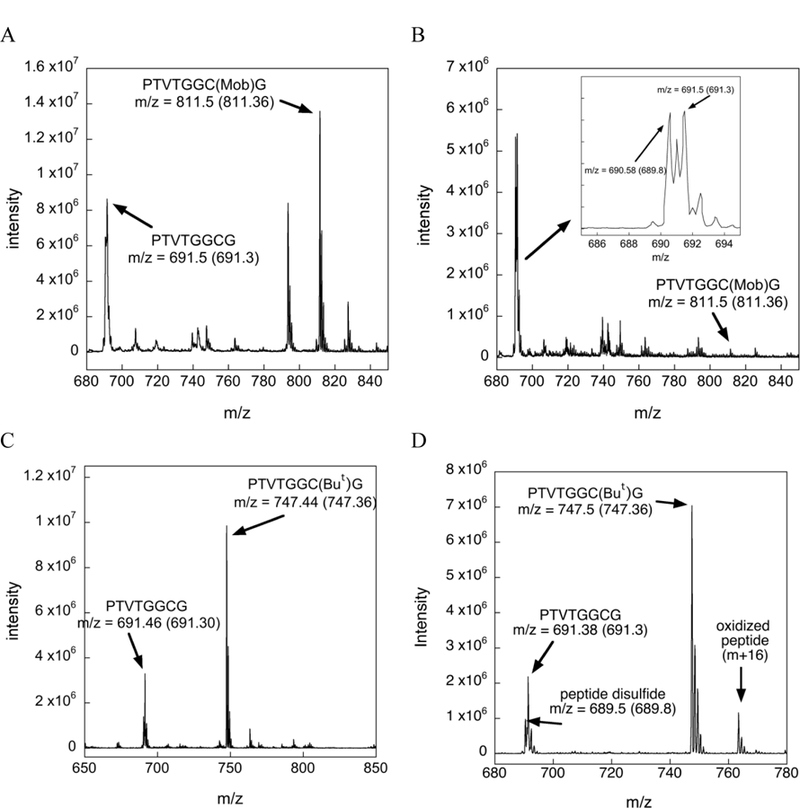
Mass chromatograms of the Cys(Mob)- and Cys(But) protected test peptides under various conditions. The arrow points to the observed m/z whereas the number inside the parentheses denotes the theoretical m/z value. (A) Mass spectrogram of the Cys(Mob) test peptide incubated in TFA for 12 h at 37 ºC. The peak at m/z = 827 corresponds to the oxidized Cys(Mob) peptide and the peak at m/z 793 corresponds to a dehydrated form of the Cys(Mob) peptide, (B) Mass spectrogram of the Cys(Mob) test peptide after incubation in TFA/TIS (98/2) for 12 h at 37 ºC. The inset shows a close up of the region between m/z 685 and m/z 695. The m/z values in the inset show the presence of the deprotected peptide and the peptide disulfide. (C) Mass spectrogram of the Cys(But) test peptide incubated in TFA for 12 h at 37 ºC. (D) Mass spectrogram of the Cys(But) test peptide incubated in TFA/TIS (98/2) for 12 h at 37 ºC.