
Figure 4.
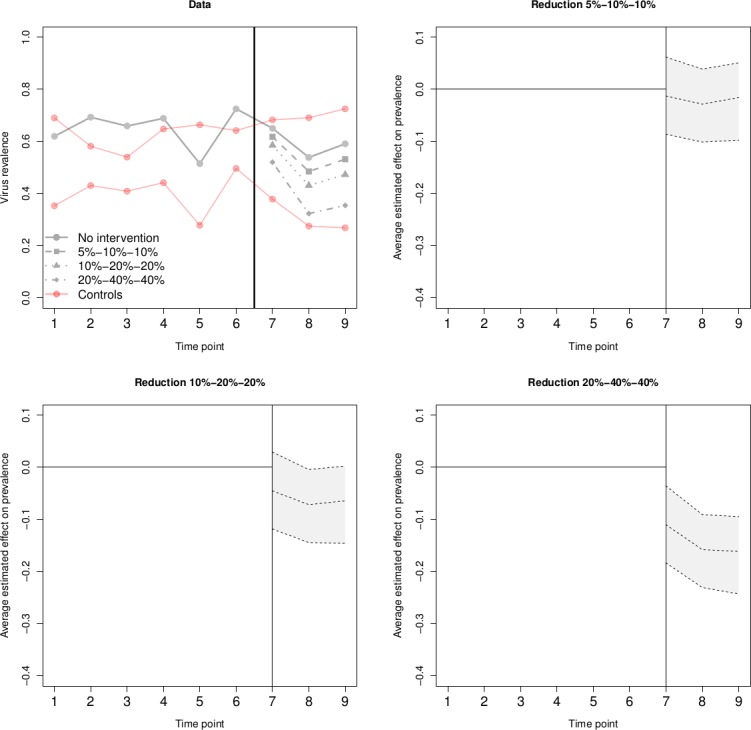
Causal impact synthetic control method (CIM) simulation and estimated intervention effects and 95% credible intervals for a range of assumed effects. Footnote: Illustration of CIM. First subplot shows a single data set, where solid lines represent the simulated prevalence in the absence of the intervention, and the dashed lines represent the outcome of treated site in the post-intervention period under different intervention magnitude scenarios. For each one of the three scenarios, we calculate the estimated average intervention effect along with credible intervals. These are shown in subplots 2 to 4. We see that as the effect increases, the intervals tend to move away for zero. However, the intervention effect only becomes significant in scenario 3, where zero is not included in any of the post-intervention time points.