Figure 2.

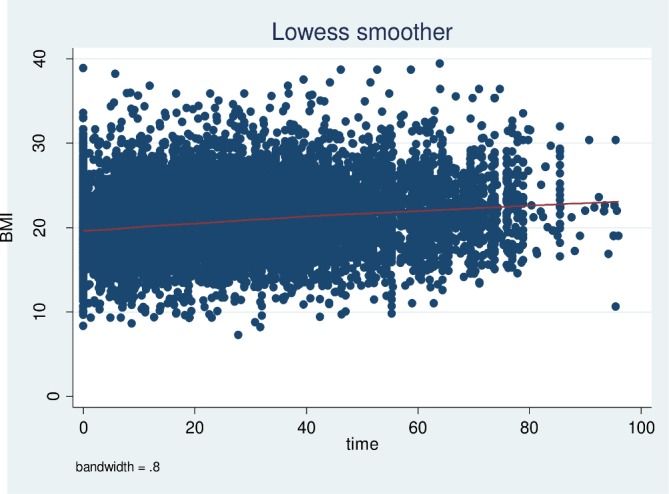
Time plot of body mass index (BMI) versus treatment time in months with LOWESS smoothed curve superimposed for patients with HIV on second-line antiretroviral therapy (ART) in Amhara region, 2008–2016.

Time plot of body mass index (BMI) versus treatment time in months with LOWESS smoothed curve superimposed for patients with HIV on second-line antiretroviral therapy (ART) in Amhara region, 2008–2016.