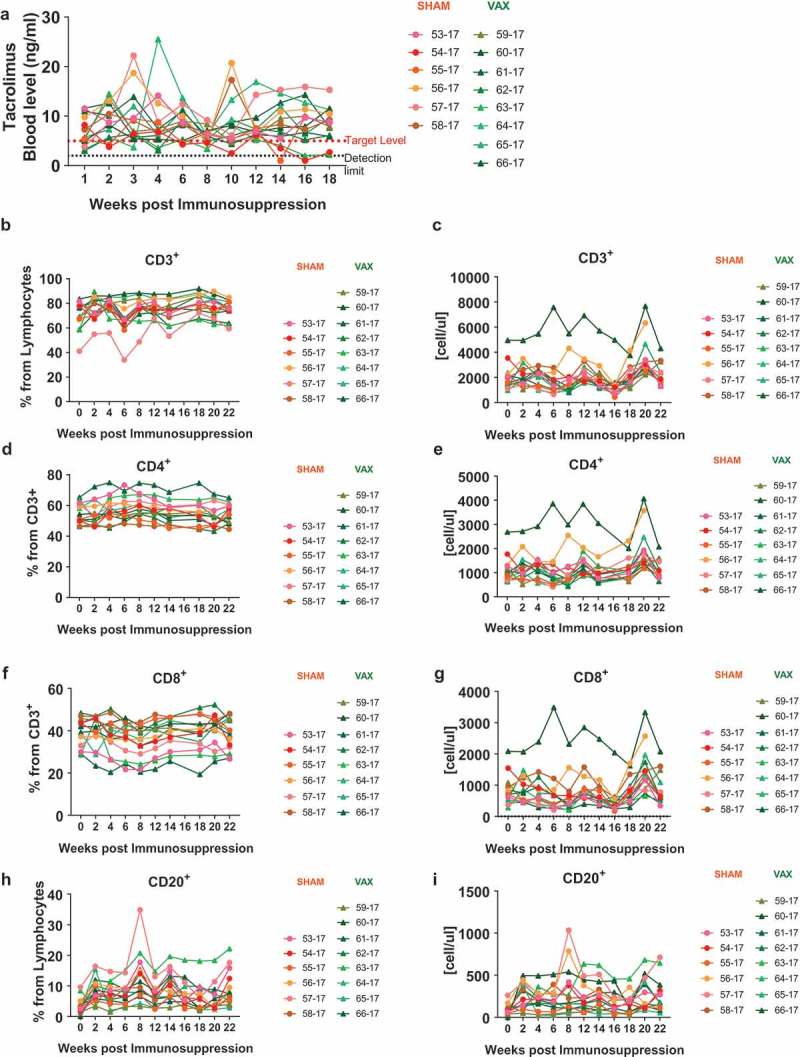
Figure 2.

Monitoring during immunosuppression. (a) Tacrolimus levels were monitored every two weeks during treatment. Dotted line indicates the level of detection of 2 ng/ml, the dashed line indicates the target level of 5 ng/ml. (b-i) Changes in immune cell populations in the blood were monitored by flow cytometry. Frequency and absolute number of (b-c) CD3+ Lymphocytes, (d-e) CD4+ T cells, (f-g) CD8+ T cells and (h-i) B cells.
