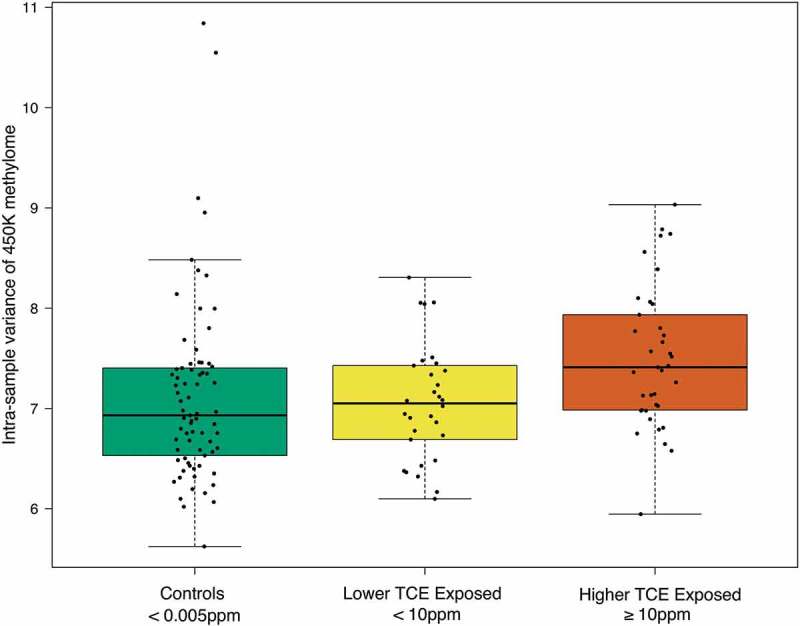
Figure 1.

Global effect of human exposure to TCE. Box/scatter plots of the variance of methylation (M-value) values across all 399,439 CpG probes, categorized by varying levels of occupational exposure to TCE. Each point represents one subjects’ variance of global DNA methylation and the boxplots display the exposure-specific distribution of these points. Data was analyzed with the Kruskal-Wallis test and with Dunn’s post-hoc test. There were statistically significant differences in the variance of global DNA methylation between the TCE exposure groups (Kruskal-Wallis test p-value = 3.75e-3). The pairs that differed significantly from each other were the higher and lower TCE exposed (Dunn test Benjamini-Hochberg adjusted p-value = 0.0108) and the higher TCE exposed and controls (Dunn test Benjamini-Hochberg adjusted p-value = 0.0018).
