Figure 3.

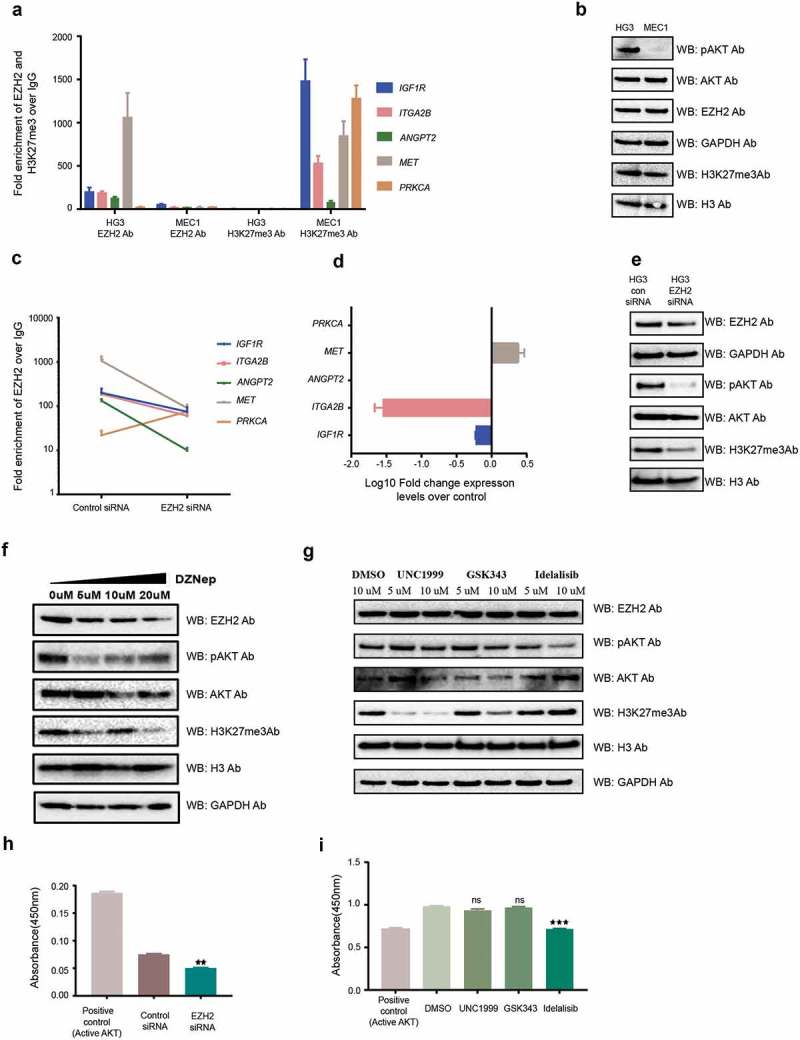
EZH2 occupancy and activation of the PI3K pathway in CLL cell lines. (a) ChIP assay data showing the average fold enrichment of EZH2 and H3K27me3 for the selected PI3K pathway target genes in the HG3 and MEC1 cell lines. (b) Western blot analysis showing protein levels for different antibodies in the HG3 and MEC1 cell lines. (c) Log10Fold change expression levels for the selected PI3K pathway target genes in EZH2 siRNA downregulated HG3 cells over control siRNA samples. (d) Western blot analysis showing protein levels for different antibodies in HG3 control siRNA and EZH2 siRNA transfected cells. (f and g) Western blot analysis showing protein levels for different antibodies using DZNep inhibitor drug and HMT inhibitor drug treatment (GSK353 and UNC1999) of HG3 cells. (h and i) The levels of active AKT analysed using the Akt Kinase activity assay kit for different EZH2 siRNA transfected and drug-treated HG3 cells.
