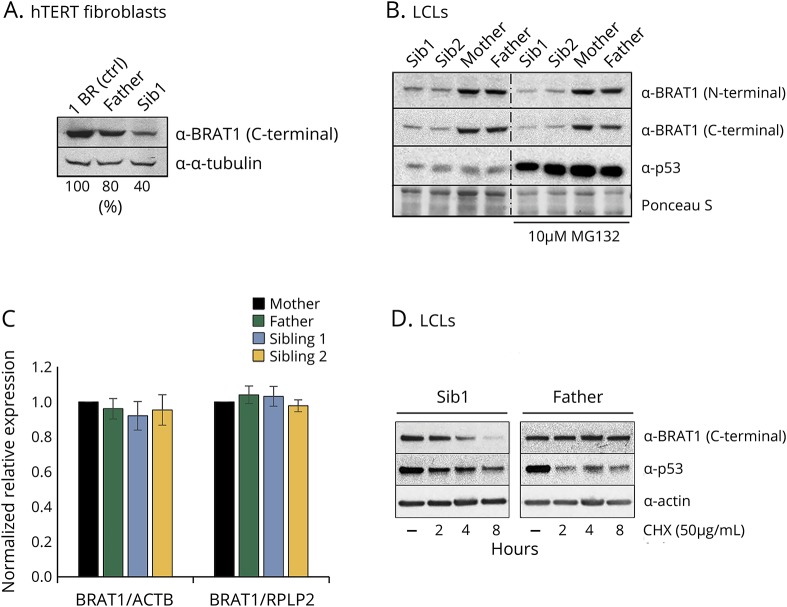
Figure 2. BRAT1 expression in patient cells.
(A) Quantification of BRAT1 protein in control (1BR), parent (Father), and BRAT1 patient (Sib1) hTERT fibroblasts normalized to tubulin levels using Image studio lite. (B) BRAT1 protein levels measured in BRAT1 patients' (Sib1 and Sib2) and parents' (Mother and Father) LCLs before and after incubation with the proteasome inhibitor MG132 by Western blotting. p53 was used as a positive control. (C) BRAT1 mRNA levels in parents' (Mother and Father) and patients' (Sib1 and Sib2) LCLs as measured by qPCR. (D) BRAT1 protein levels measured in BRAT1 patient (Sib1) and parent (Father) LCLs before and after incubation with the protein synthesis inhibitor CHX by Western blotting. Note that default exposure levels were adjusted. p53 was used as a positive control. CHX = cycloheximide; LCL= lymphoblastoid cell line.

