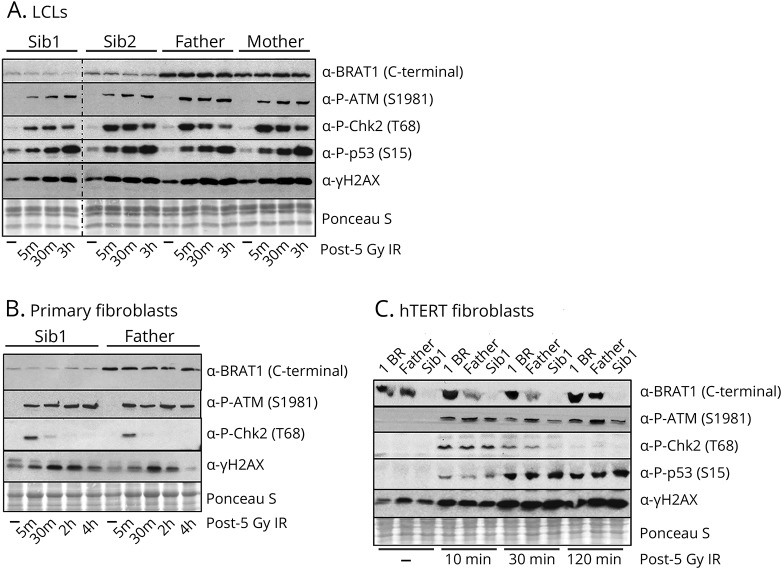
Figure 3. ATM activation in BRAT1 patient cells.
Western blot analysis of the phosphorylation of ATM kinase and its downstream substrates in indicated BRAT1 patients (Sib1 and Sib2), parents (Mother and Father), and control (1BR) (A) LCLs, (B) primary fibroblasts and/or (C) hTERT fibroblasts before and after ionizing irradiation (IR, 5 Gy) as indicated. ATM = ataxia telangiectasia mutated.

