Figure 2.
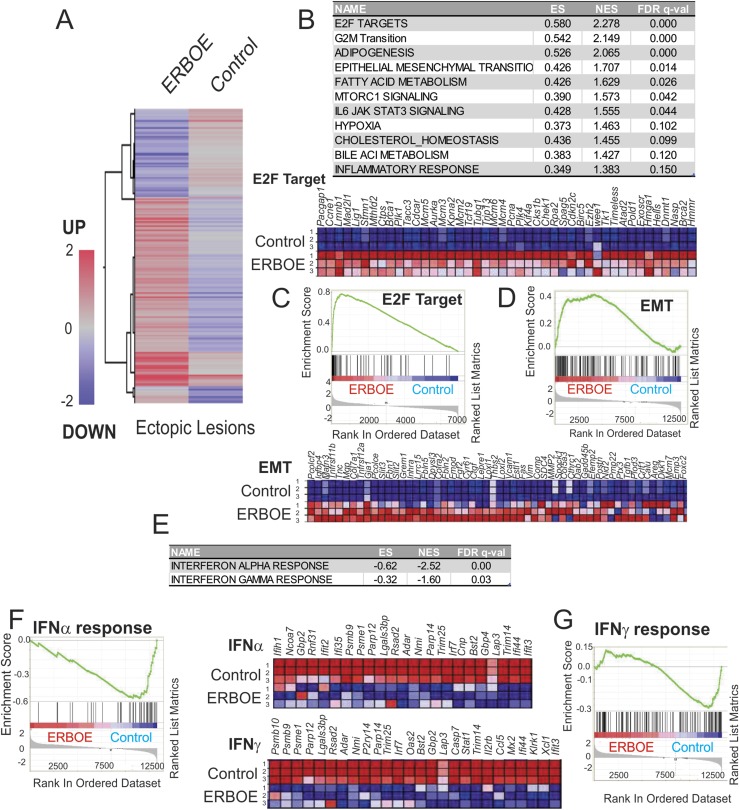
Overexpression of ERβ changes cellular pathways in ectopic lesions to enhance endometriosis progression. (A) Heat map of differential gene expression profiles (>1.5-fold upregulation or downregulation) in ERβ-overexpressing ectopic lesions vs control ectopic lesions (average gene expression levels from nine samples per group). (B) Cellular pathways >1.5-fold upregulated in ERβ-overexpressing ectopic lesions compared with ectopic control lesions determined by GSEA. (C) GSEA analysis revealed that ERβ overexpression elevated genes signature associated with the E2F target genes in ectopic lesions. Relative expression of the E2F target gene set in control vs ERβ overexpressing ectopic lesions (N = 3) are shown in order of their signal/noise ratio rank. (D) Genes involved in EMT signaling that is promoted in ERβ-overexpressing ectopic lesions compared with ectopic control lesions. Relative expressions of the EMT gene set in control vs ERβ overexpressing ectopic lesions (N = 3) are shown in order of their signal/noise ratio rank. (E) Cellular pathways >1.5-fold downregulated in ERβ-overexpressing ectopic lesions compared with ectopic control lesions determined by GSEA. (F) GSEA analysis revealed that ERβ overexpression reduced gene signatures associated with the IFNα signaling in ectopic lesions. Relative expressions of the IFNα signaling gene set in control vs ERβ overexpressing ectopic lesions (N = 3) are shown in order of their signal/noise ratio rank. (G) GSEA analysis revealed that ERβ overexpression reduced genes signature associated with the IFNγ signaling in ectopic lesions. Relative expressions of the IFNγ signaling gene set in control vs ERβ overexpressing ectopic lesions (N = 3) are shown in order of their signal/noise ratio rank. EMT, epithelial-mesenchymal transition; ES, enrichment score; FDR, false discovery rate; NES, normalized enrichment score.

