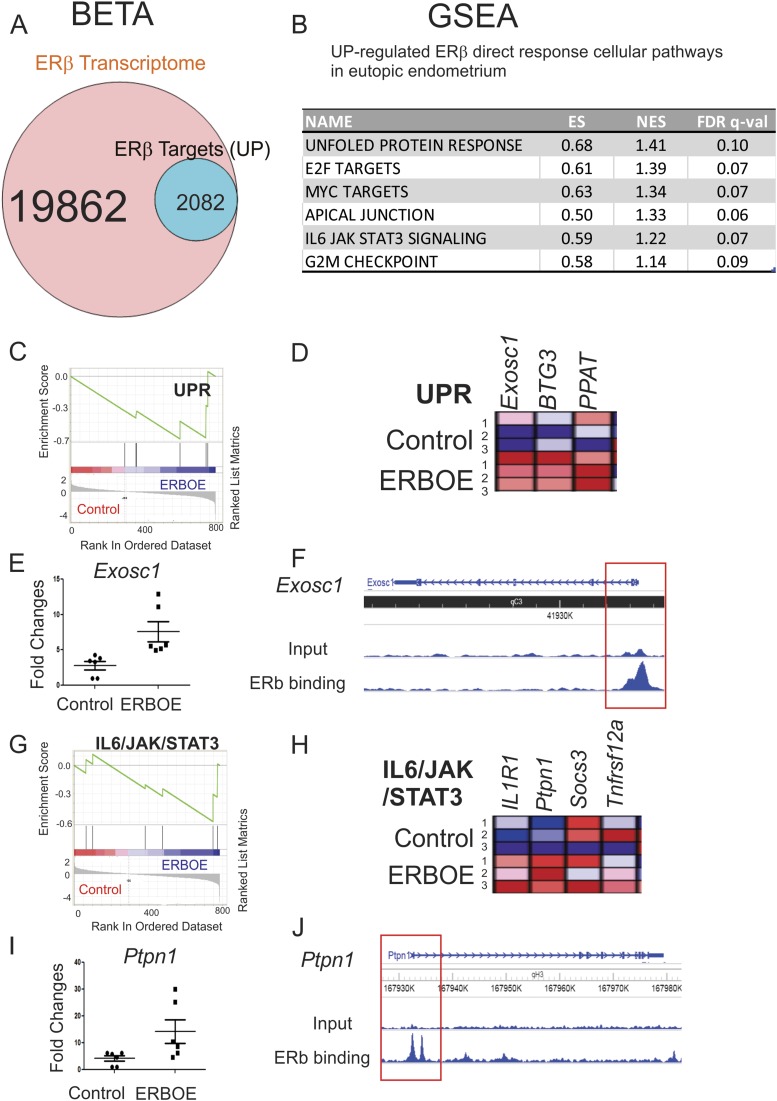
Figure 7.
Cellular pathways directly upregulated by ERβ in the eutopic endometrium. (A) BETA with ERβ transcriptome and ERβ cistrome in eutopic endometrium showed that 10.5% (2082 of 19,862) of genes were upregulated by ERβ and statistically enriched near the ERβ binding sites (P < 0.05) in eutopic endometrium. (B) GSEA with 2082 transcripts predicted cellular pathways upregulated >1.5-fold by direct ERβ target genes in the eutopic endometrium. (C) GSEA analysis revealed that ERβ overexpression elevated genes signature associated with the UPR signaling in eutopic endometrium. (D) Relative expressions of the UPR gene set in control vs ERβ-overexpressing eutopic endometrium (N = 3) are shown in order of their signal/noise ratio rank. (E) The expression of Exosc1 determined by RT-qPCR was elevated in ERBOE eutopic endometrium compared with control eutopic endometrium. The fold changes are shown relative to Exosc1 level in control eutopic endometrium. (F) WashU Epigenome Browser image of ChIP-seq peak data revealed that ERβ bound to the promoter region of Exosc1 gene loci in eutopic endometrium compared with the input signal. (G) GSEA analysis revealed that ERβ overexpression elevated gene signatures associated with the IL-6/JAK/STAT3 signaling in eutopic endometrium. (H) Relative expressions of the IL-6/JAK/STAT3 gene set in control vs ERβ-overexpressing eutopic endometrium (N = 3) are shown in order of their signal/noise ratio rank. (I) The expression of Ptpn1 determined by RT-qPCR was elevated in ERBOE eutopic endometrium compared with control eutopic endometrium. The fold changes are shown relative to Ptpn1 level in control eutopic endometrium. (J) WashU Epigenome Browser image of ChIP-seq peak data revealed that ERβ bound to the promoter region of Ptpn1 gene loci in eutopic endometrium compared with the input signal. ES, enrichment score; FDR, false discovery rate; NES, normalized enrichment score.

