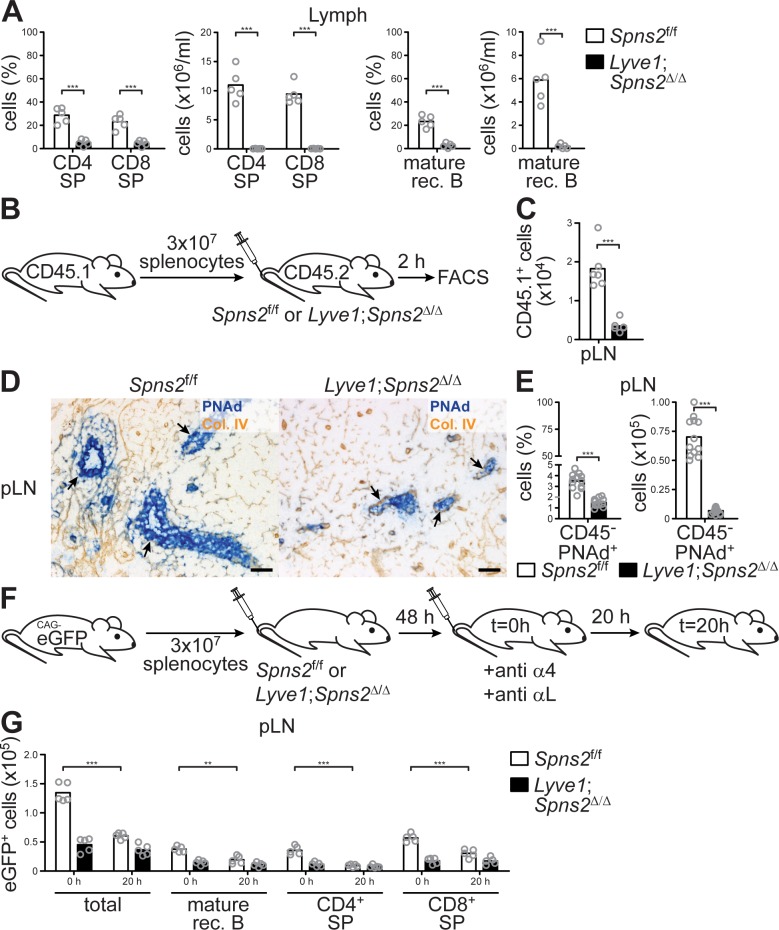
Figure 2. The immigration of lymphocytes into pLNs and their egress into the lymphatic system is severely impaired in Lyve1;Spns2Δ/Δ mice.
(A) FACS analysis of CD4+ and CD8+ SP T-cells (left) and mature rec. B-cells (right) of lymph fluid isolated from the cisterna chyli of Spns2f/f and Lyve1;Spns2Δ/Δ mice. (B) Experimental flow-chart of short-terming homing assays to quantify lymphocyte immigration into pLNs. (C) FACS analysis of total congenic CD45.1+ cells in pLNs two hours upon injection of WT splenocytes into Spns2f/f and Lyve1;Spns2Δ/Δ mice. (D) Light microscopy of frozen sections of pLNs of Spns2f/f (left) and Lyve1;Spns2Δ/Δ (right) mice for PNAd+ HEVs (blue) counterstained for collagen-IV+ (brown). (E) FACS analysis of total CD45-/CD31+/PNAd+ high-endothelial cells isolated from pLNs of Spns2f/f and Lyve1;Spns2Δ/Δ mice. (F) Experimental flow-chart of homing assays to quantify lymphocyte egress from pLNs. (G) Total numbers of congenic eGFP+ cells in pLNs at 0 hr and 20 hr upon injection of anti-α4 / anti-αL antibodies into Spns2f/f and Lyve1;Spns2Δ/Δ mice. Each circle (A, C, E, G) represents an individual mouse; bars indicate the mean. Scale bars, 50 μm (D). **p<0.005; ***p<0.0005 (two-tailed unpaired Student’s t-test (A, C, E, G)). Data are representative for five mice per group pooled from two independent experiments (A) with n = 2 or n = 3 mice per group (A), for six mice per group (D) or are pooled from two (C, G) or three (E) independent experiments with n = 2, n = 3 or n = 4 mice per group.


