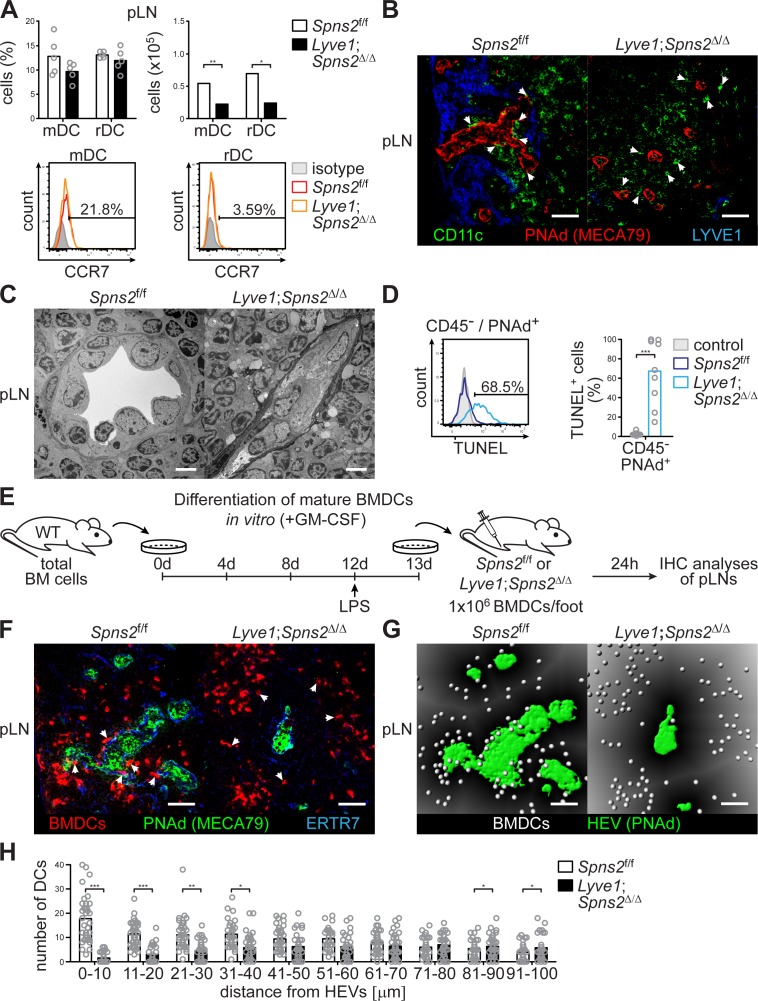
Figure 3. SPNS2-derived S1P controls interactions of PNAd+ HEVs with lymph-derived dendritic cells in pLNs.
(A) FACS analysis of CCR7-expression on endogenous conventional mDCs (CD3-/CD19-/CD11cint/MHC-IIhi) and rDCs (CD3-/CD19-/CD11chi/MHC-IIint) isolated from pLNs of Spns2f/f and Lyve1;Spns2Δ/Δ mice. (B) Confocal microscopy of pLNs of Spns2f/f (left) and Lyve1;Spns2Δ/Δ (right) mice for CD11c+ (green) DCs, PNAd+ (red) HEVs and Lyve-1+ (blue) LECs. (C) TEM images of HEVs in pLNs of Spns2f/f and Lyve1;Spns2Δ/Δ mice. (D) Flow-cytometric TUNEL assay on CD45-/CD31+/PNAd+ high-endothelial cells isolated from pLNs of Spns2f/f and Lyve1;Spns2Δ/Δ mice. (E) Experimental flow-chart of BMDC-differentiation in vitro, and lymphatic homing assays of footpad injected BMDCs to quantify DC-immigration from afferent lymphatics into pLNs of Spns2f/f and Lyve1;Spns2Δ/Δ mice. (F) Confocal microscopy of pLNs of Spns2f/f (left) and Lyve1;Spns2Δ/Δ (right) mice for CMTMR+ BMDCs (red), PNAd+ (green) HEVs and ERTR7+ (blue) fibroblastic tissue networks. (G) Visualisation of the automated detection of individual CMTMR+ BMDCs (white spheres) from PNAd+ HEVs (green surface) in pLNs of Spns2f/f (left) and Lyve1;Spns2Δ/Δ (right) mice. Grey gradients visualise the distance transformation from HEVs (green surface) defined by PNAd-staining. (H) Total numbers of BMDCs (white spheres in (F)) in distances from 0 μm - 100 μm from HEVs counted in 10 μm radial areas around HEVs in pLNs of Spns2f/f and Lyve1;Spns2Δ/Δ mice. Each circle represents an individual mouse (A, D) or total numbers of BMDCs around HEVs in the visual field of a micrograph (H); bars indicate the mean. Scale bars, 5 μm (C), 50 μm (B, F, G). *p<0.05; **p<0.005; ***p<0.0005 (two-tailed unpaired Student’s t-test (A, D, H)). Data are representative for six mice per group pooled from two (A, B) or three (D) independent experiments with n = 3 (A) or n = 4 per (D) mice group, for 2x pLNs and 2x iLNs of three mice per group (C), for 36x representative individual sections of 2x analyzed popliteal LNs per mouse pooled from two independent experiments (H) with n = 6 mice per group (H).


