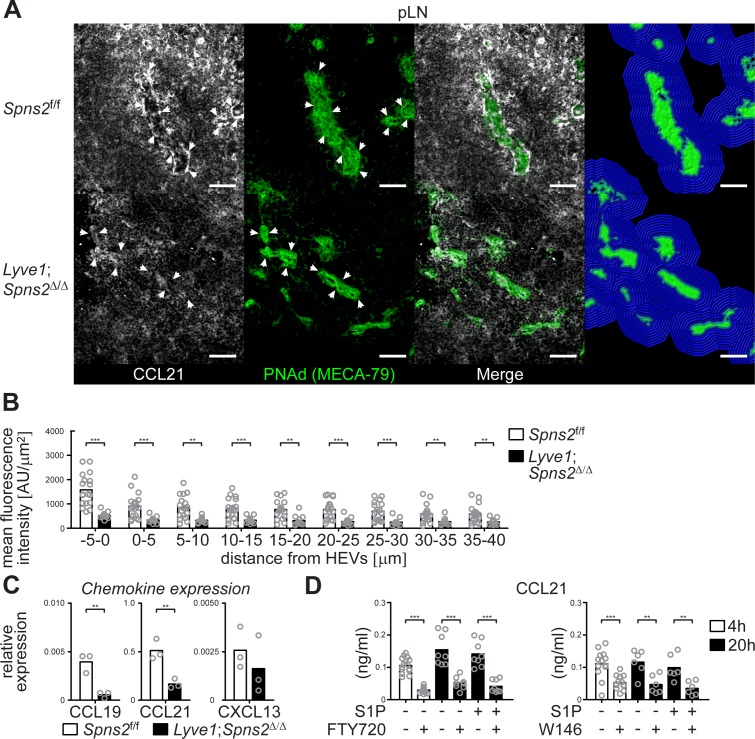
Figure 7. CCL21-production and -release from HEVs is severely impaired in pLNs of Lyve1;Spns2Δ/Δ mice.
(A) The IHC analysis of CCL21 (white) distribution around PNAd+ HEVs, and visualisation of the automated detection of PNAd+ HEVs (green surface) and of the radial areas (blue) around HEVs used for the quantification of the mean fluorescent intensity of the CCL21 signal in pLNs of in Spns2f/f (top) and Lyve1;Spns2Δ/Δ (bottom) mice. (B) The mean fluorescent intensity of the CCL21 signal in distances from −5 μm to 40 μm from the outer border of HEVs (green surface in (C)) determined in 5 μm radial areas around HEVs in pLNs of Spns2f/f and Lyve1;Spns2Δ/Δ mice. (C) qRT-PCR analysis of CCL19, CCL21 and CXCL13 expression levels in total mRNA isolated from CD45-/CD31+/PNAd+ high-endothelial cells sorted from pLNs of Spns2f/f and Lyve1;Spns2Δ/Δ mice. (D) ELISA of the CCL21 levels of the supernatant of high-endothelial cells cultivated with or without 10 μM FTY720 (left) or 10 μM W146 (right) in vitro. Each circle represents the mean fluorescent intensity of the CCL21 signal detected around HEVs in the visual field of a micrograph (B), the relative chemokine expression levels in mRNA extracted from the total CD45-/CD31+/PNAd+ high-endothelial cells (C), or the CCL21 protein levels detected in the supernatant of individual cell cultures (D) of CD45-/CD31+/PNAd+ high-endothelial cells; bars indicate the mean. Scale bars, 50 μm (A). **p<0.005; ***p<0.0005 (two-tailed unpaired Student’s t-test (B–D)). Data are representative for 18x individual sections of 2x analyzed pLNs, iLNs and bLNs per mouse pooled from three mice per group (A, B), three independent mRNA preparations of 2x pLNs, iLNs and bLNs per mouse pooled from five mice per group (C), or three independent stimulations with n = 2 to n = 4 of a total of 8x – 16x (FTY720) or 6x – 12x (W146) individual cell cultures (D) with total sorted high-endothelial cells from 2x pLNs, iLNs and bLNs per mouse pooled from five mice per group in vitro.

