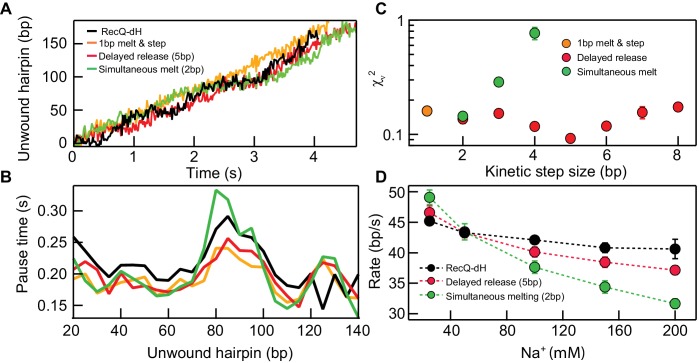
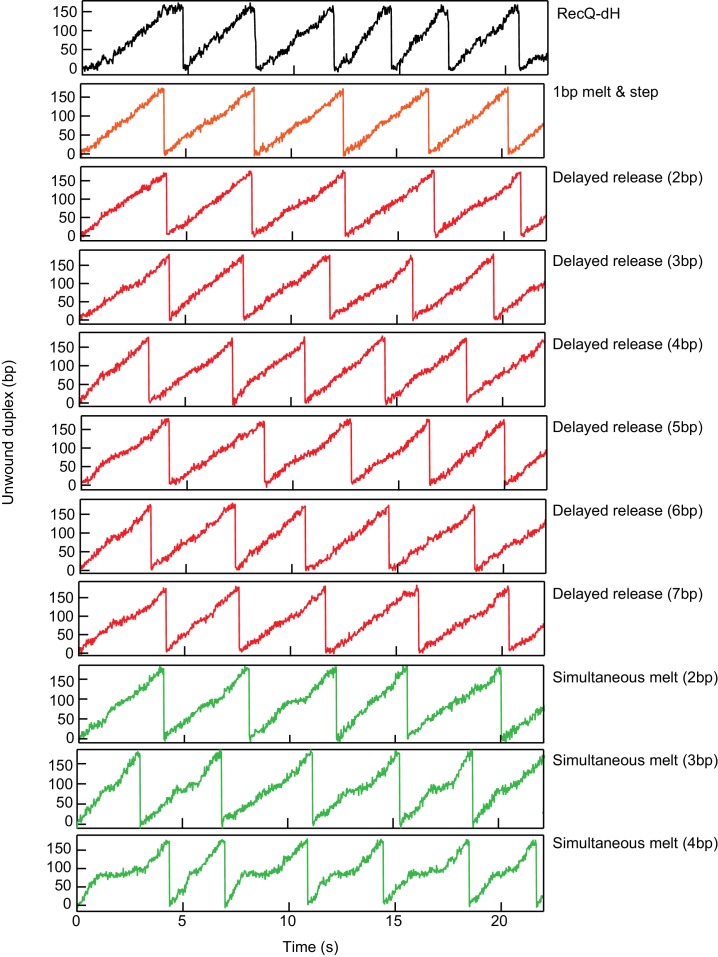
Figure 3. Kinetic modeling of the kinetic step-size.
(A) Example simulated 174 bp DNA hairpin unwinding traces (1 bp melt and step (orange line), 1 bp melt and 5 bp step (red line), and 2 bp melt and step (green line)) overlaid with an example RecQ-dH unwinding trace (black line). Unwinding traces were simulated using Equations 1 and 2. The overall unwinding events are composed of pauses of lifetime (τp) due to melting of the base-pairs, followed by a rapid translocation step in time (τt). τp was calculated based on the sequence stability using nearest neighbor energy parameters (Patten et al., 1984; SantaLucia, 1998; Huguet et al., 2010). The total duration was adjusted to match the mean unwinding rate of RecQ-dH. (B) Pause times plotted as a function of the unwound hairpin for the three example models (with the same marker and line colors) in panel (A). Pause times and positions were obtained by analyzing simulated unwinding traces (100 traces for each condition) using T-test analysis and averaging pause times over a 5 bp window. The experimental pause lifetimes of RecQ-dH are shown in the black solid line. (C) Reduced χ2 (χν2) measure of the correspondence between measured and simulated pause durations as a function of pause position plotted as a function of the kinetic step size for three kinetic stepping models (see main text): 1 bp melt and step (orange filled circles), 1 bp melt and n bp step (red filled circles), and n bp melt and step (green filled circles). χν2 for 1 bp melt and step is significantly larger than the minima of the other two models. The χν2 is minimized for n = 2 bp for the n-bp melt and step model whereas χν2 is minimized for n = 5 bp for the 1 bp melt and n bp step model. (D) Na+ dependent unwinding rates of RecQ-dH (black filled circles and dashed line) and predictions of the two kinetic models with the kinetic step-size, n, that minimizes χν2 for each model: 1 bp melt and 5 bp step (red filled circles and dashed line), and 2 bp melt and step (green filled circles and dashed line). The error bars correspond to the standard error of the mean (SEM).


