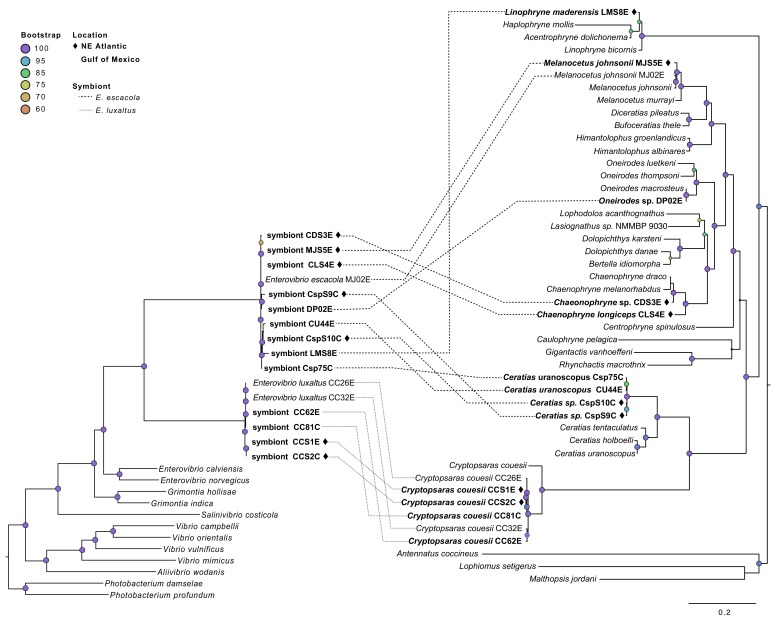
Figure 2. Symbiont phylogeny (left) constructed using single-copy protein-coding genes compared to the host phylogeny constructed using mitochondrial genes (right).
Bolded samples are unique to this study. Samples from the Northern Atlantic denoted with ♦, and the bootstrap values over 60 are listed at tree nodes. Linkages between symbionts and their hosts are shown with dotted lines that differentiate between symbiont species.

