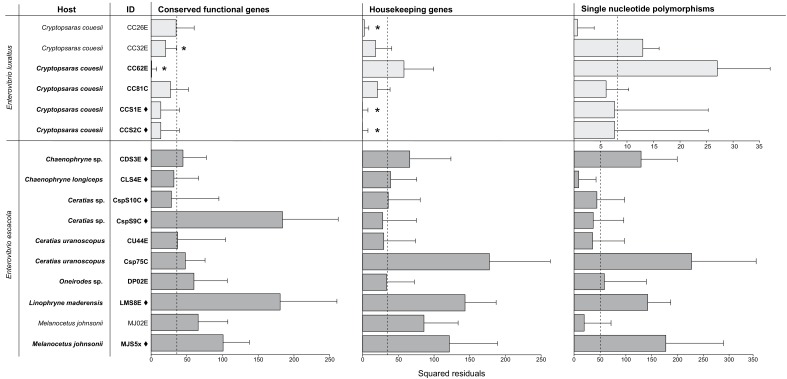
Figure 3. Procrustean Approach to Cophylogeny using a host matrix constructed using mitochondrial gene phylogeny compared to symbiont matrices constructed using the single-copy protein-coding gene phylogeny (p=2e-05) and housekeeping genes phylogeny (p=2e-05).
SNPs phylogenies were analyzed for each species, and the scale for E. luxaltus was dissimilar to the E. ecacola; neither were statistically significant (p>0.5 for analysis of both species). The squared residuals below the median squared residual value (dotted line) are significantly codiverging with the host phylogenies (marked with an asterisk). Sample IDs from the Northern Atlantic are marked with a ♦ and those from the Gulf of Mexico are unmarked.

