. 2019 Oct 1;8:e39596. doi: 10.7554/eLife.39596

Figure 3. Lumenal pressure drives otic vesicle growth.

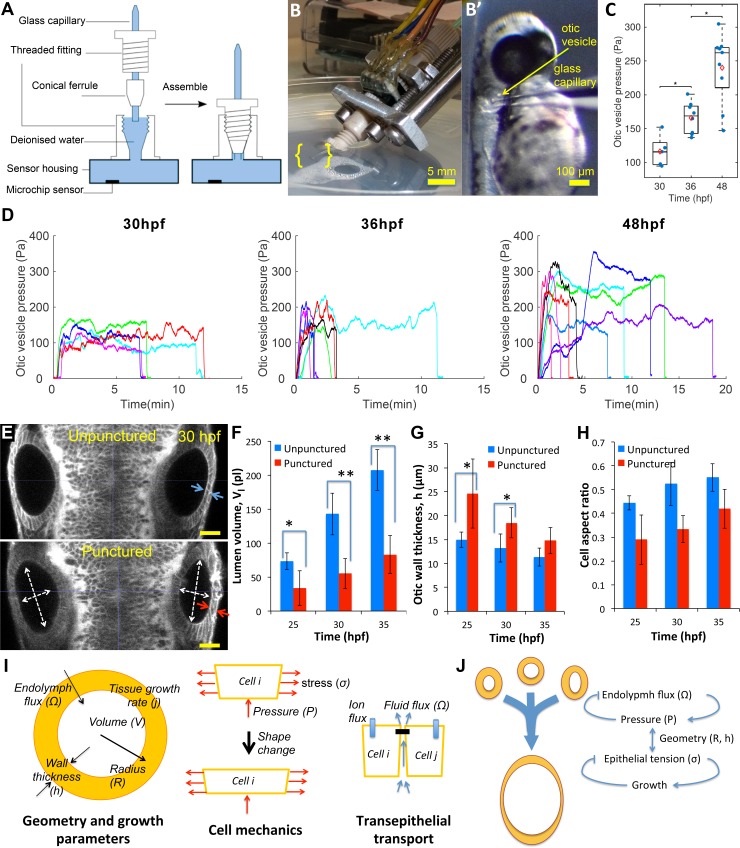
Pressure measurements in the otic vesicle using a piezo-resistive solid-state sensor. (A) Schematic drawing of the pressure probe assembly, not to scale. (B) The capillary-based probe is mounted on a micromanipulator and zebrafish embryos are immobilized and mounted in Danieau buffer. (B’) Under a stereo microscope, the glass capillary is inserted into the otic vesicle. (C) Otic vesicle pressures at different developmental stages of wild-type zebrafish embryos (red diamond: mean value. *p<5.0e-2). (D) Pressure was measured in otic vesicle at 30 hpf, 36 hpf, and 48 hpf. Presented trajectories were live readings from embryos immobilized with α-bungarotoxin protein. Each color represents an individual test. (E) 2D confocal micrographs showing both ears at 30 hpf before (top) and after (bottom) unilateral puncture of the right vesicle. Changes in cell shape from squamous (blue arrows) to columnar (red arrows) are shown. Scale bar is 25 µm. (F–H) Quantification of changes from puncturing: (F) lumen volumes (Vl, n = 10, *p<1.0e-4,**p<1.0e-5), (G) average vesicle wall thickness (h, n = 10, *p<5.0e-3), and (H) average cell aspect-ratio (n = 10, error bars are SD). (I) Model relating vesicle geometry, growth rate, and fluid flux to pressure, tissue stress, and cell material properties. (J) Multi-scale regulatory control of otic vesicle growth linking pressure to fluid transport. Related to Figure 3—figure supplements 12.

Figure 3.

Figure 3—figure supplement 1. Pressure probe calibration and characterizations.

Figure 3—figure supplement 1.

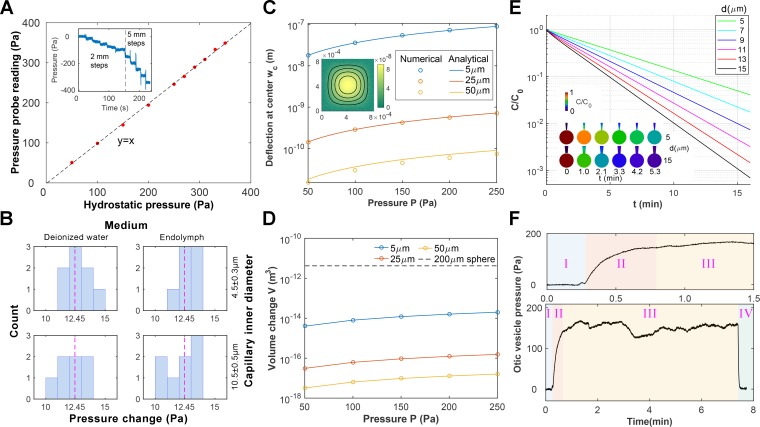
(A) The fabricated pressure probe was calibrated with hydrostatic pressure by reducing the submersion depth stepwise (inset, 1mmH2O = 9.8 Pa), which demonstrated good linearity. (B) The pressure probes were calibrated against combinations of the capillary inner diameter and the ionic composition of the bath medium. The probes were displaced stepwise (1.27mmH2O = 12.45 Pa, dotted line) and the histogram of pressure changes is shown. No dependence on the configurations is observed. (C–D) Calculations of membrane deformation on the piezoresistive sensing element. Colors represent different membrane thickness. (C) The numerical results are compared against analytical solutions for the deformation at the membrane center. (Inset) A selected solution is shown for a 5 µm membrane under 250 Pa pressure. The corresponding volume changes are shown in (D) and the volume of a 200 µm diameter sphere is plotted in dotted line as a reference. (E) Calculations of diffusive mixing between endolymph and capillary filling after puncturing. Their initial ionic concentrations are C0 and 0, respectively. The mean ionic concentration inside the vesicle C decreases over time t at a rate depending on the capillary inner diameter d. (Inset) Selected solutions are shown for d = 5, 15 µm in the first 5 min. (F) Stages in an otic vesicle pressure measurement. Upper: zooming into the first 1.5 min. I: the tip was placed near the vesicle. The hydrostatic pressure was used as the baseline. II: after puncturing, the pressure built up gradually. III: after reaching a plateau, the pressure fluctuated around a mean value. This value was taken as the measurement result. IV: Upon withdrawing the tip from the vesicle, the pressure dropped to the base line, proving that the probe had been sensing the hydrostatic pressure in the enclosed domain.
Figure 3—figure supplement 2. Otic vesicle puncturing experiments.

Figure 3—figure supplement 2.

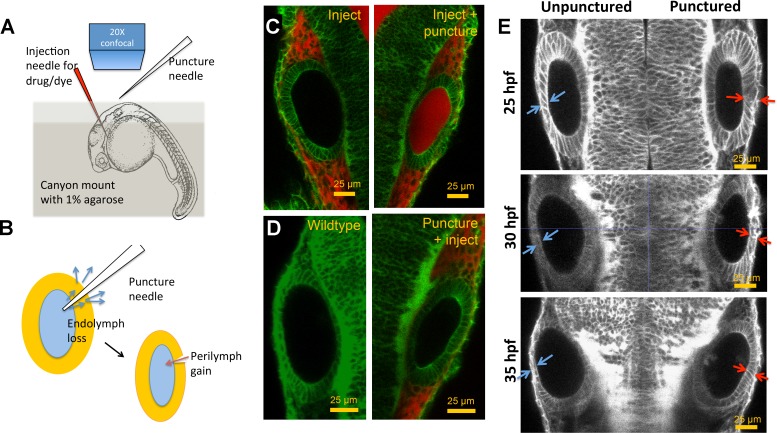
(A) Embryos are mounted in a canyon mount made with 1% agarose for confocal imaging of left and right vesicles with a 20X objective. Drugs or dyes are injected into the cardiac chamber and get distributed rapidly throughout the embryo including the perilymph surrounding the ear. (B) Schematic showing the route of lumenal fluid loss upon puncture and movement of dye from perilymph into the lumen. (C) 2.3 nl of 0.5 mM Alexa Fluor 594 tracer dye injected into the cardiac chamber at 30 hpf. The dye enters the circulation and is found to accumulate in the perilymph regions surrounding the vesicle. Puncturing of otic vesicle causes the dye to leak into the lumenal cavity. (D) Injection of dye five minutes post-puncture restricts dye transport to the perilymph, thus demonstrating the rapid sealing property of the otic tissue. (E) 2D confocal micrographs showing ear pairs in embryos with unilateral puncture of the right ear and staged at 25, 30, and 35 hpf. Cell shape change in unpunctured and punctured ears are highlighted using blue and red arrows respectively. Progressively through time, puncturing causes smaller transitions in cell shapes between ear pairs.