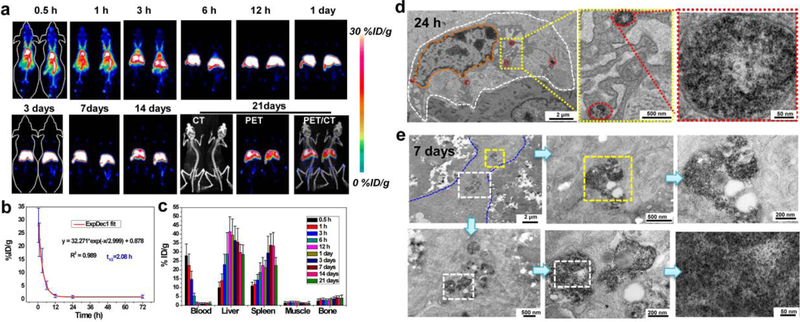
Figure 2. Biodistribution of ceria NPs in vivo.
a Representative maximum intensity projection PET images of mice at various time points after i.v. injection of 89Zr-ceria NPs. b Time-activity curve of 89Zr-ceria NPs in the blood. c Quantification of 89Zr-ceria NPs uptake in the blood, liver, spleen, muscle, and bone at various time points p.i.. Bio-TEM images of mouse liver sinusoid showing the presence of NPs in the liver at 24 h (d) or 7 days (e) after i.v. injection of ceria NPs. White dashed line in (d) highlights the outline of Kupffer-like cells, while the orange dashed line within indicates the nucleus of Kuffper-like cells and red dash ovals showed the endocytosis of ceria NPs by lysosome. Blue dashed line in (e) highlights other cut direction of Kupffer-like cells and the white or yellow dashed rectangles showed the enlarged portion of the images. In a-c, data represent means ± s.d. from three independent replicates.

