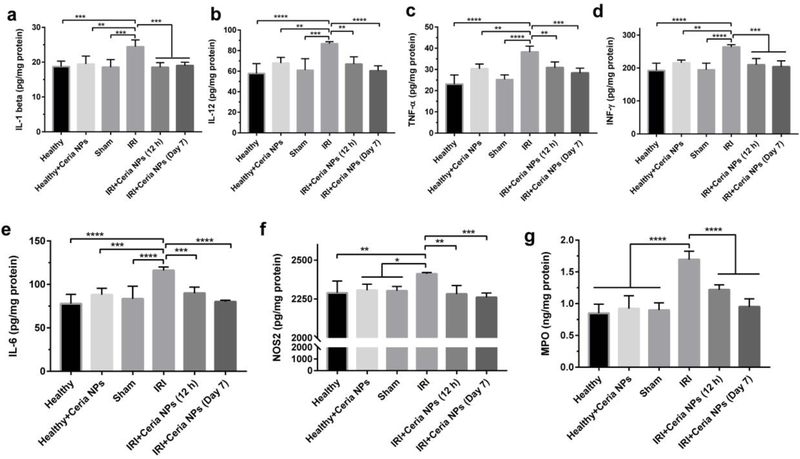
Figure 5. Detection of cytokines in liver tissues.
Cytokines of IL-1 (a), IL-12 (b), TNF-α (c), INF-γ (d), IL-6 (e), and NOS2 (f) from activated monocyte/macrophages and Kupffer cells and MPO (g) from activated neutrophil were measured in liver homogenates form each group. Data represent means ± s.d. from five independent replicates, and P values were calculated by one-way ANOVA with Tukey’s honest significant difference post-hoc (*p < 0.05; **p < 0.01; *** p < 0.001; ****p < 0.0001).

