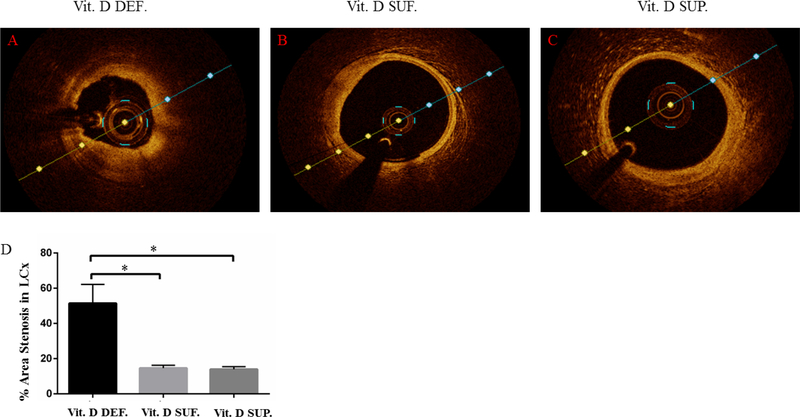
Figure 1. Vitamin D deficiency enhances coronary restenosis: Optical coherence tomography (OCT) imaging.
Panel A shows restenosis occurred in the coronary arteries after angioplasty in animals that were fed with vitamin D deficient diet (Vit. D DEF.).
Panel B shows the extent of restenosis after angioplasty seen in the coronary arteries of animals that were fed with sufficient levels of vitamin D sufficient (Vit. D SUF.).
Panel C shows restenosis in the coronary arteries of vitamin D supplemented animal group.
The degree of post-interventional percentage area restenosis in the coronary arteries of all animal groups was calculated using OCT integrated software and the data was represented as a bar diagram (D). The number of animals in each group were n=3. Data were compared with t- test analysis where a p-value of less than 0.05 was considered statistically significant. Actual p-values noted here were less than 0.01; *p<0.01.

