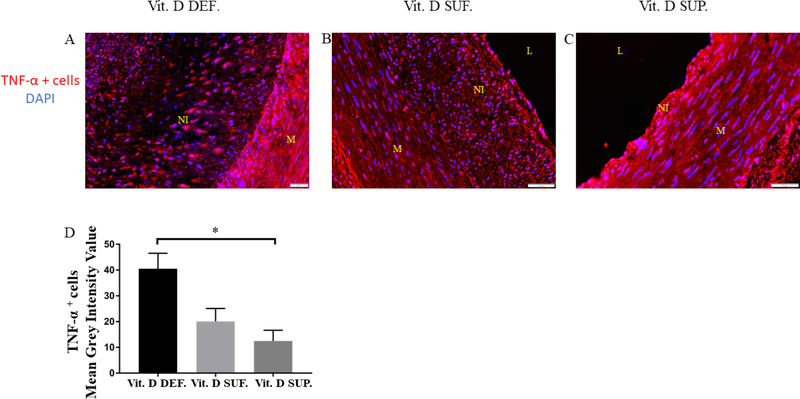
Figure 3. Expression of TNF-α in the PTCA-injured LCX of microswine fed a High cholesterol diet.
Panel A–C shows TNF-α expressing cell in the neointima of the PTCA LCx. Expression of TNF-α is in vitamin D deficient (Vit. D DEF.) swine greatest compared to vitamin D sufficient (Vit. D SUF.) and vitamin D supplemented swine (Vit. D SUP.). The mean grey scale intensity of TNF-α expressing cells was measured for each treatment group (panel D). (n=3 in each treatment group) *p=0.02. L=lumen, M=media, NI=neointima

