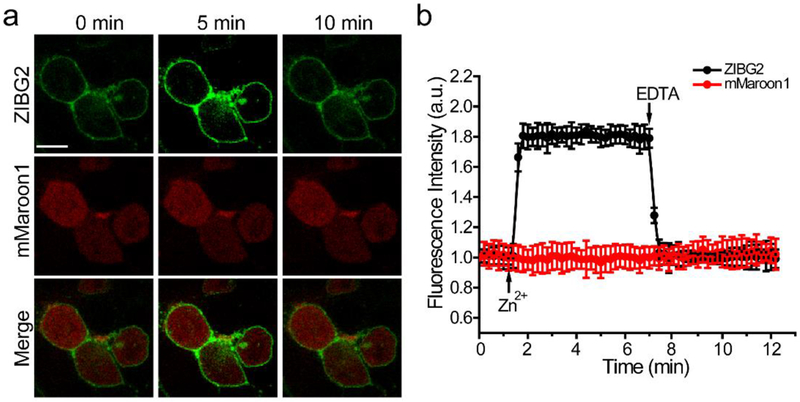
Figure 3.
Fluorescence imaging of pDisplay-ZIBG2 in HEK 293T cells. (a) Fluorescence images of HEK 293T cells expressing pDisplay-ZIBG2 before and after sequential addition of ZnCl2 (100 μM) and EDTA (100 μM). Cells were co-transfected with a far-red FP, mMaroon1, which serves as an internal control. Scale bar: 20 μm. (b) Quantitative results presented as mean and s.d. of 20 cells from three independent replicates. The arrows show the time points for addition of ZnCl2 and EDTA.

