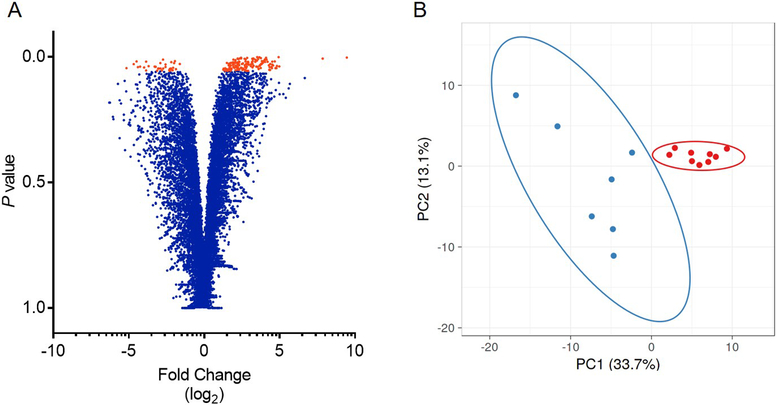
Figure 2. Differentially expressed genes in granulosa cells of cows with metritis.
A volcano plot (A) represents each gene detected using RNAseq as an individual dot. Genes that were differentially regulated in granulosa cells of metritis cows are shown in orange (P ≤ 0.05), and non-significantly affected genes are shown in blue. Expression of genes is based on the log2 fold change (x-axis) plotted against the P value for each gene. (B) Plot for principal component analysis of RNAseq data from granulosa cells of cows that had metritis (blue) or control cows (red).

