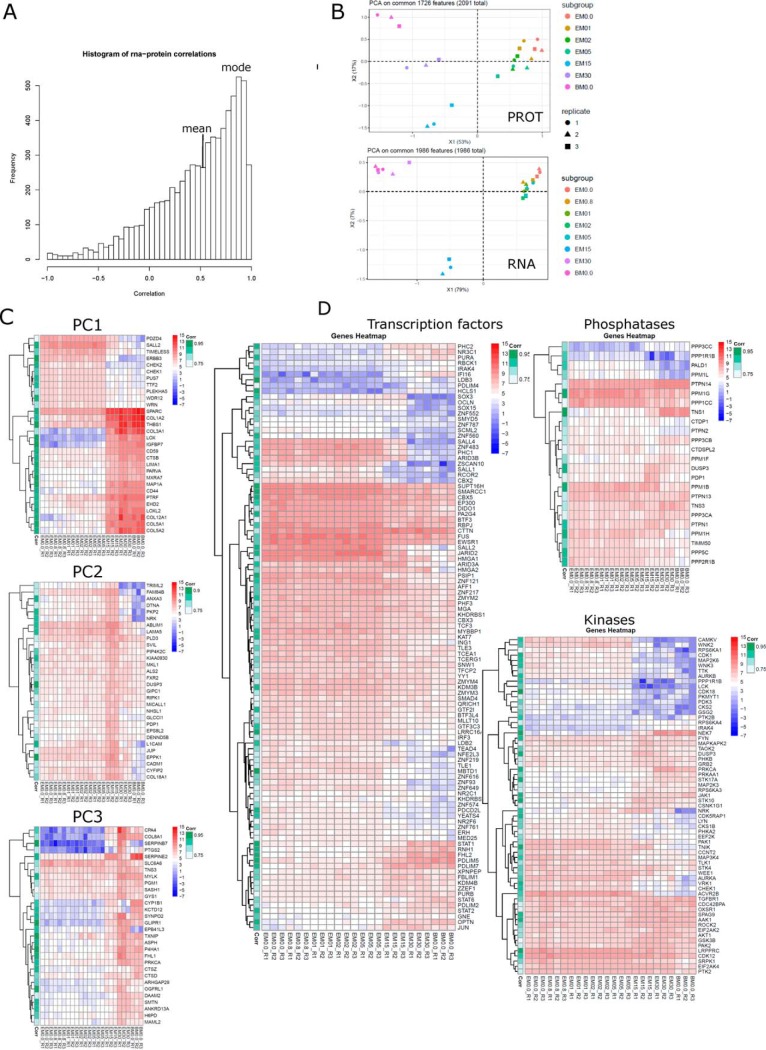
Fig. 5.
RNA-PROT correlation. A, Distribution of RNA-PROT correlation with mean and mode indicated. B, PCA on features with R > 0.7 and FDR < 0.05 for PROT and RNA. C, Hierarchical clustering of top30 features per principal components 1–3. D, Hierarchical clustering of transcription factors, kinases and phosphatases, which show good RNA-PROT correlation (R > 0.7, FDR < 0.05). RNA transcripts are shown with RNA-PROT correlation indicated on the left. Legends for expression intensity and correlation are on the right.

