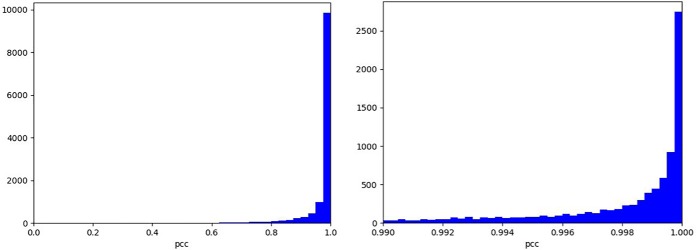
Fig. 3.
PCC distribution for charge state distribution prediction versus experimental measurement of the test dataset. The MS1 charge state distribution prediction model was trained with 90% of 126,876 experimental distributions. 10% of those were used as the test dataset to evaluate the model shown in this figure. Left: full range. Right: zoomed range of [ 0.99, 1].

