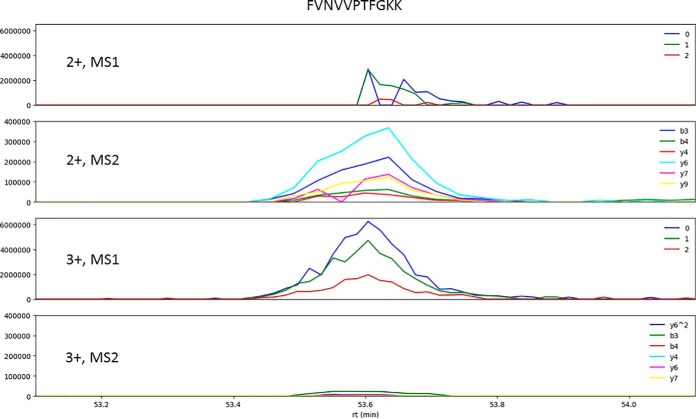
Fig. 7.
Extracted ion chromatograms of FVNVVPTFGKK 2+ and 3+ precursor ions from a DIA experiment. The first and the third panels are from survey or MS1 scans; they have the same vertical scale. The labels are 0, the precursor's monoisotopic peak; 1 and 2, the first and second isotopic peaks. The second and fourth panels are from MS2 scans with the corresponding selection windows; they also have the same vertical scale. The labels indicate the six most abundant (determined by the use of the HCD sequence ion intensity prediction model) product ions used for extraction.

