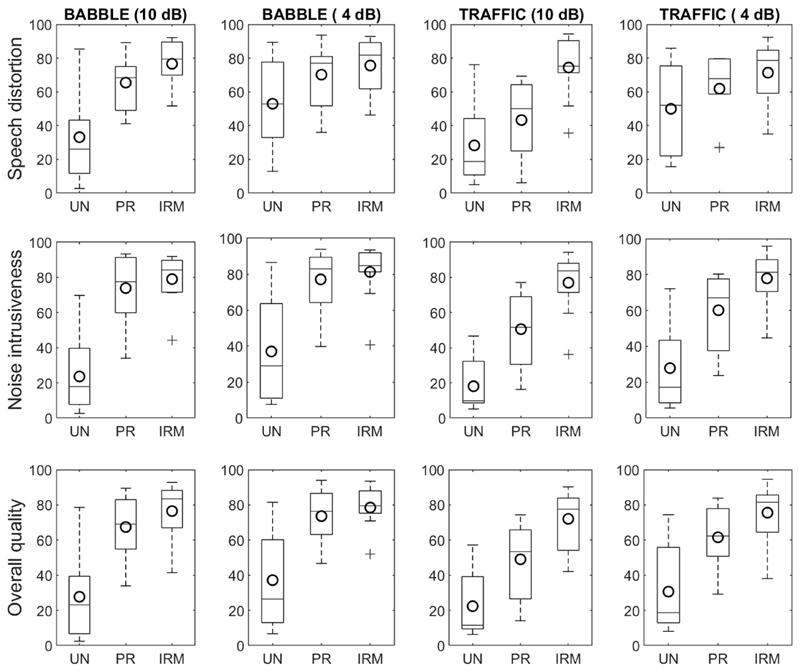
Fig. 7.
Subjective ratings shown as boxplots and mean scores (circles) for speech distortion noise intrusiveness, and overall quality for conditions UN, PR, and IRM and for SNRs of 4 and 10 dB. The backgrounds were babble (columns 1 and 2) and traffic (columns 3 and 4). Lower scores indicate more negative ratings (e.g. ‘very distorted’ and ‘bad quality’).

