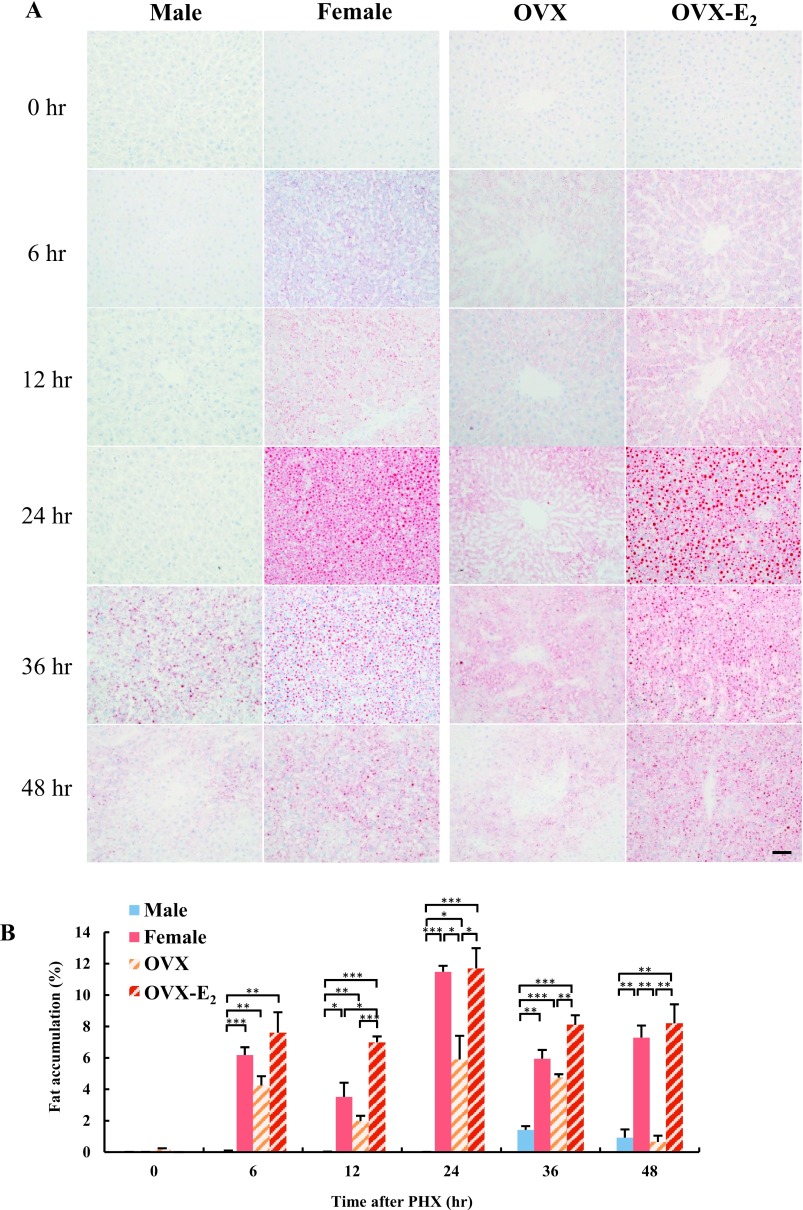
Fig. 1.
Fat accumulation in rat liver at different time points after PHX. (A) Fat accumulation in hepatocytes following PHX in male, female, OVX and OVX-E2 was examined by Oil Red O staining. Magnification 400×. Bar = 50 μm. (B) Semi-quantitative analysis of Oil Red O stained liver tissue sections to quantify fat deposition as a percentage of red stained area compared with the total section area. Blue, red, diagonal bar on white background and diagonal bar on red background graphs represent male, female, OVX and OVX-E2, respectively. Data represent the mean ± SE from 3 rats per group and time point. Asterisks indicate statistically significant differences (*p < 0.05, **p < 0.01 and ***p < 0.001).

