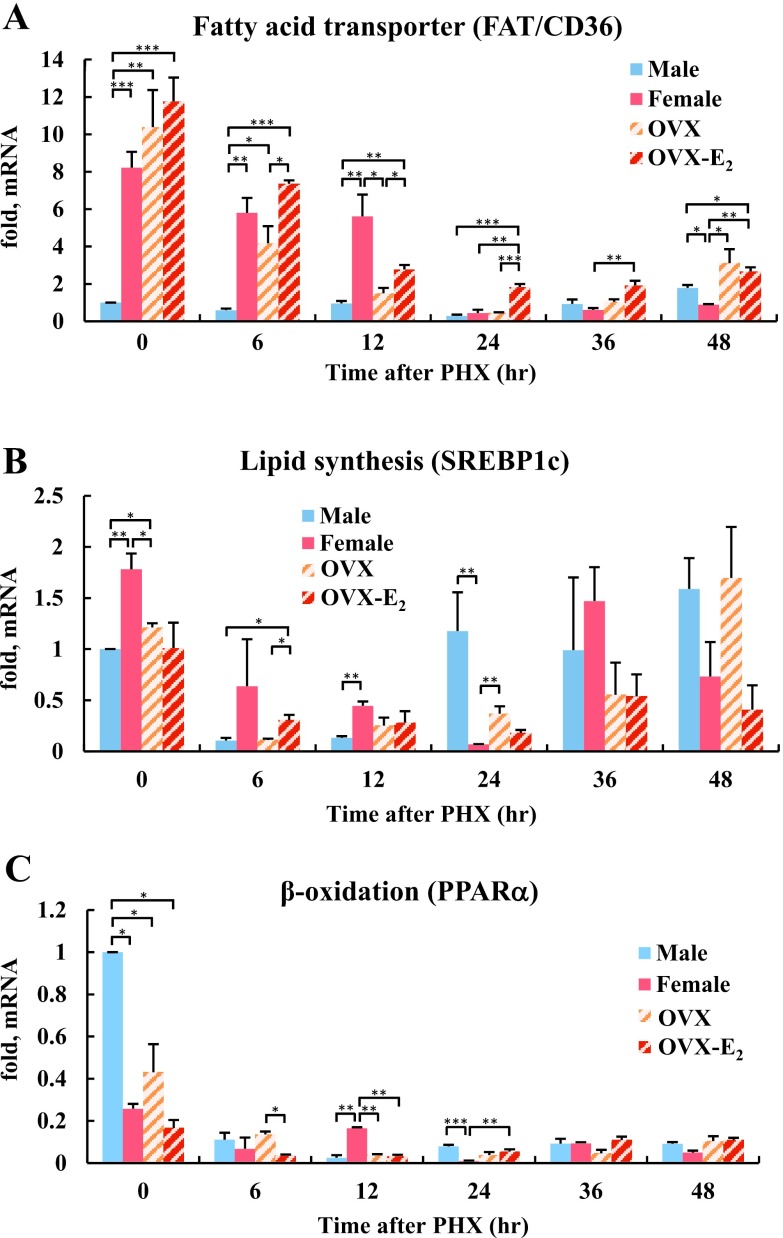
Fig. 3.
The expression of genes involved in lipid metabolism during rat liver regeneration. (A) Quantitative RT-PCR analysis of mRNA levels for the fatty acid transporter gene FAT/CD36, (B) lipid synthesis gene SREBP1c and (C) the β-oxidation gene PPARα. The mRNA expression levels are represented as fold change compared with male rat liver at 0 hr after PHX. Blue, red, diagonal bar on white background and diagonal bar on red background graphs represent male, female, OVX and OVX-E2, respectively. Data represent the mean ± SE from 3 rats per group and time point. Asterisks indicate statistically significant differences (*p < 0.05, **p < 0.01 and ***p < 0.001).

