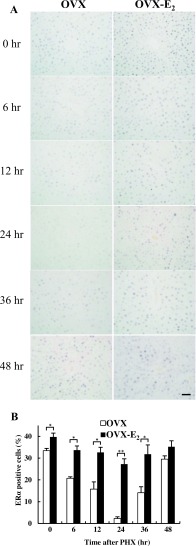
Fig. 6.
ERα expression in rat livers after PHX. (A) Immunohistochemical analysis of ERα staining in paraffin-embedded sections from OVX and OVX-E2 rat livers at different time points after PHX. Magnification 400×. Bar = 50 μm. (B) The number of ERα positive cells in OVX and OVX-E2 rat livers after PHX. White and black bar-graphs represent OVX and OVX-E2, respectively. Data represent the mean ± SE from 3 rats per group and time point. Asterisks indicate statistically significant differences (*p < 0.05 and **p < 0.01).

