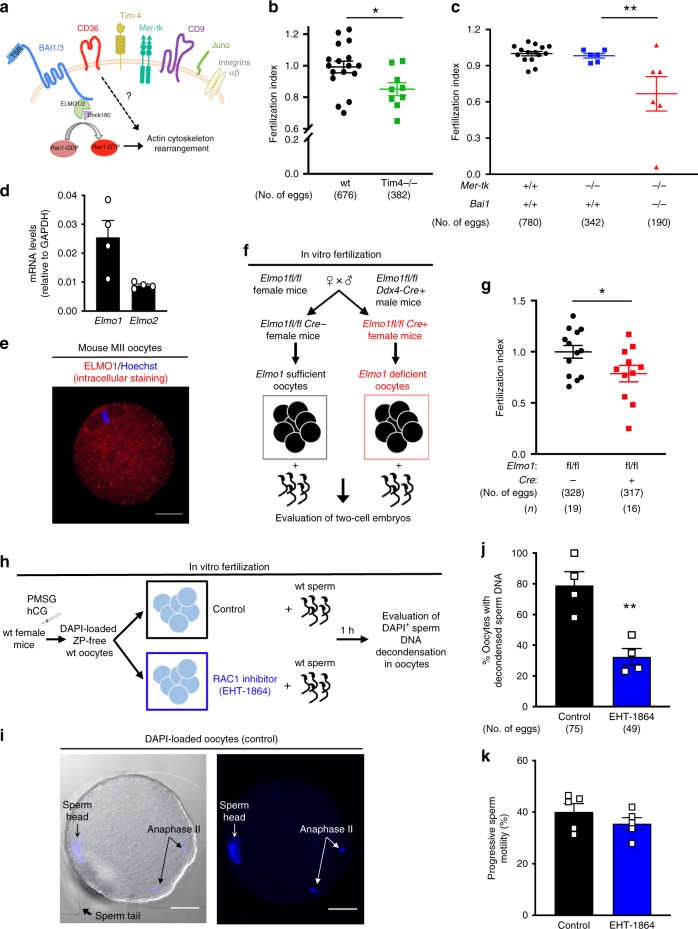
Fig. 3.
Genetic testing of PtdSer receptors and cytoplasmic signaling in oocytes. a Schematic of PtdSer receptors BAI1/3, the downstream ELMO-DOCK-RAC1 signaling pathway, and other receptors on oocytes. b, c The PtdSer receptors Tim-4, BAI1 and Mer-TK participate in fertilization. ZP-intact oocytes from wt or Tim-4−/− mice b Mer-tk + / + Bai1 + / + , Mer-tk−/− Bai1 + / + , or Mer-tk−/− Bai1 + /- or Mer-tk−/− Bai1−/− c were mixed with wt sperm, and two-cell embryos evaluated at 24 h. Fertilization index is the percentage of fertilized eggs from the experimental group divided by percentage of fertilized eggs from the control group (wt mice). Each dot represents one mouse (b, n = 6 experiments including 17 wt mice and 9 Tim-4−/− mice, c: n = 5 experiments including 15 wt mice, 6 Mer-tk−/− Bai1 + / + and 6 Mer-tk−/− Bai1−/−), total number of eggs (parentheses). *p < 0.05 (b, two-tailed unpaired Student t test), **p < 0.01 (c one-way ANOVA followed by Dunnet’s multiple comparisons test). d Elmo1 and Elmo2 mRNA on cumulus-free Metaphase II oocytes. e Intracellular ELMO1 in isolated Metaphase II (MII) ZP-free oocytes. Scale bar, 20 μm. f Schematic for generation of oocyte-specific Elmo1-deficient mice. g Percentage of fertilized eggs after incubation of control (Elmo1fl/fl) or Elmo1-deficient (Ddx4-Cre/Elmo1fl/fl) oocytes with wt sperm (n = 6 independent experiments including 15 Elmo1fl/fl mice and 12 Ddx4-Cre/Elmo1fl/fl mice). Each dot represents 1 or 2 pooled mice. *p < 0.05 (Two-tailed unpaired Student’s t test). h Schematic for the evaluation early sperm entry into oocytes via DAPI staining of decondensed sperm DNA. ZP-free wt oocytes were incubated with RAC1 inhibitor (EHT-1864, 80 μm) and loaded with DAPI. After several washes, sperm were added, and the presence of internalized sperm with decondensed nuclei was evaluated after 1 h. i Control oocytes displaying the decondensation of the sperm DNA incorporated into the oocyte (arrow), whereas the sperm tail has not yet been internalized. DAPI also highlights the oocyte chromosomes in anaphase II indicating the resumption of meiosis II. Scale bar, 20 μm. j, Decreased percentage of oocytes with decondensed sperm DNA after RAC1 inhibition (n = 4 independent experiments). Numbers in parentheses reflect total number of eggs scored. **p < 0.01 (Two-tailed unpaired Student’s t test). k Sperm motility was not affected by RAC1 inhibition p > 0.05 (two-tailed unpaired Student’s t test). Data are presented as mean ± s.e.m. Source Data are provided in the Source Data File

