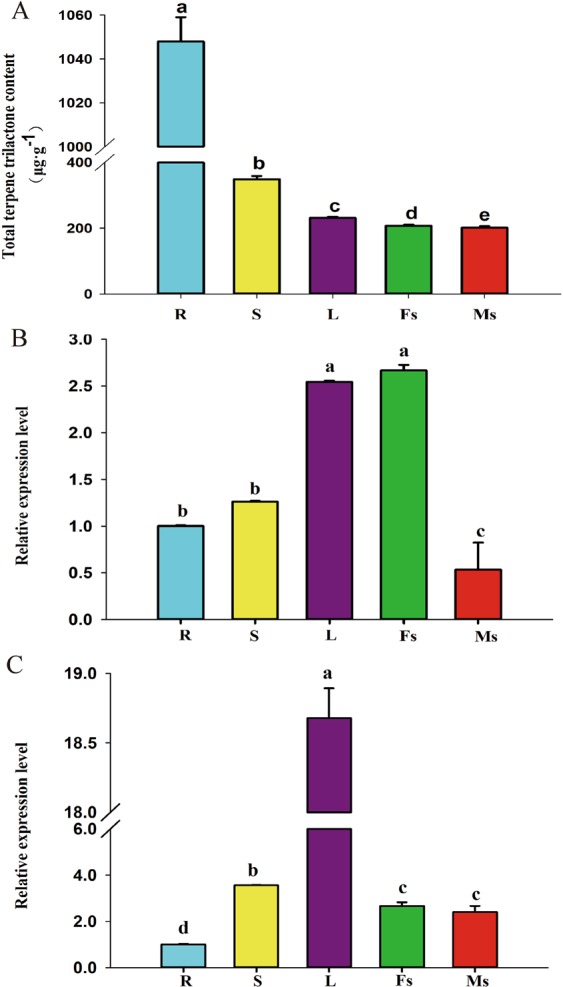
Figure 5.

The accumulation pattern of TTLs and tissue expression patterns of GbHMGR2 and GbHMGR3 in different tissues of G.biloba. (A) Accumulation pattern of TTLs in different tissues; (B) Tissue expression patterns of GbHMGR2; (C) Tissue expression patterns of GbHMGR3. R: Root, S: Stem, L: Leaf, Fs: Female strobili, Ms: Male strobili; The gene expression level of GbHMGR2 and GbHMGR3 in the ginkgo root was set to 1. Data are shown as mean ± SE (n = 3); Means with different letters represent a Tukey’s honestly significant difference at p < 0.05.
