Figure 1.
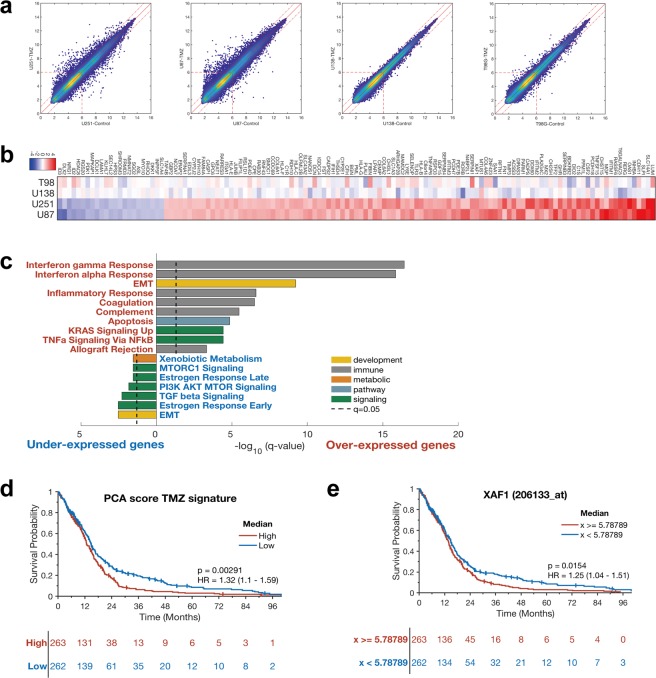
Microarray and gene signature analysis in GBM resistant cells and survival analysis in TCGA GBM. (a) The pairwise comparison of the naïve and the resistant cell lines. (b) Heatmap using the 129 genes, fold change values are between naïve and treated. (c) Gene set enrichment analysis using the Hallmark gene sets for the up-regulated or down-regulated genes and pathways in U251 and U87 cell lines. (d) PCA signature from TMZ cell line experiment are related to survival in TCGA GBM data (p = 0.00291). (e) TCGA GBM data shows XAF1 expression is significantly related to survival of GBM patients, especially long term (p = 0.0154).

