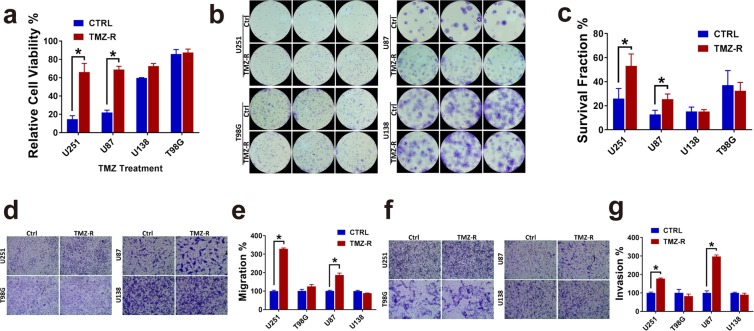
Figure 2.
TMZ resistance increased GBM cells viability, proliferation, migration and invasion. (a) 1 × 10³ U251, U87, U138, T98G control cells or resistance cells were seeded in 96 well plates. Cells were then treated with TMZ (100 μM) for 5 days and cell viability was measured by the XTT Assay. The relative viabilities are shown. With significance for U251, p = 0.009; for U87, p = 0.001. (b) The colony forming ability of U251, U87, U138, T98G control cells were compared with resistant cells. (c) Clone number calculation in colony formation. With significance for U251, p = 0.017; for U87, p = 0.045. (d, e) Trans-well migration assay of U251, U87, U138, T98G control versus resistant cells. Cells were induced to move through membranes for 24 hours. Membranes were then fixed, stained and photographed (d) or quantitated (e). Control cell numbers were normalized as 100%. With significance for U251 p = 1.16E-05; for U87 p = 0.003. (f,g) Trans-well Invasion assay of U251, U87, U138, T98G control versus resistance cells. Cells were induced to invade through Matrigel-coated membranes for 24 hours. Membranes were then fixed, stained and photographed (f) or quantitated (g). Control cell numbers were normalized as 100%. With significance for U251 p = 0.0008; for U87 p = 0.0003. All experiments were performed in triplicate and the error bar represent the mean ± SD; n = 3, with significance *p < 0.05 by Student’s t-test.

