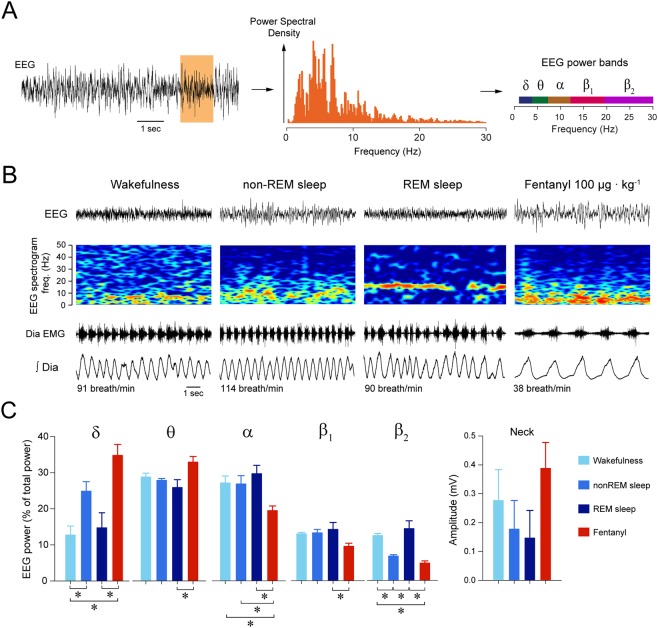
Figure 2.
Fentanyl induces distinct electrocortical changes associated with sedation. (A) Electrocortical power spectral density and power bands were calculated for each epoch. (B) Epochs were then categorized as wakefulness, non-REM sleep, REM sleep, or sedation (following fentanyl 100 µg · kg−1). Spectrograms of electrocortical activity, i.e. the distribution of electrocortical powers from 0 to 50 Hz, show that fentanyl increased electrocortical power between 0 and 10 Hz and decreased power between 20–50 Hz compared to wakefulness. (C) Mean data showed that fentanyl increased significantly δ power but decreased significantly β2 power compared to wakefulness (n = 7). During non-REM sleep, δ power was higher than in wakefulness (n = 7), whereas β2 was lower (n = 7). There was no significant difference in the amplitude of neck muscle activity between states. EMG, electromyogram. *Indicate mean data significantly different with P < 0.05. Data are presented as mean ± SEM.

