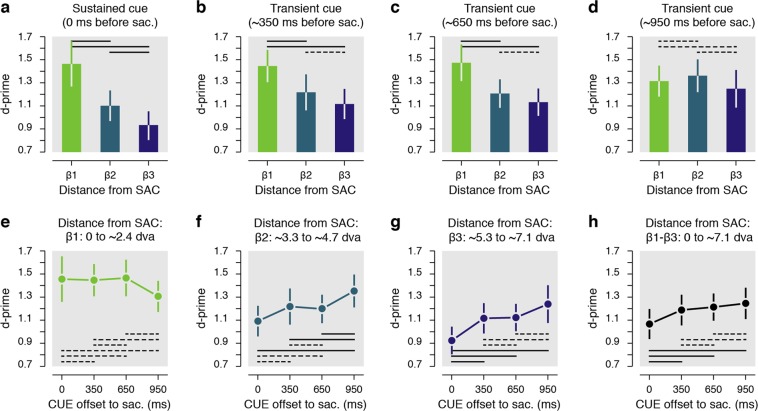
Figure 5.
Results grouped based on the attentional probe’s distance from the saccade endpoint. (a–d) Presaccadic sensitivity as a function of the distance from the saccade endpoint (β1–β3). Data are shown for the sustained cue (a) and the transient cue conditions (b–d). The transient cue condition is binned in three equal groups of trials where the cue offset precedes the saccade by approximately 350 ms (b), 650 ms (c) or 950 ms (d). (e–h) Presaccadic sensitivity as a function of the duration between the cue offset and the saccade onset. Data are shown separately for three main distances of the DT from the saccade endpoint (e–g) and for all trials, irrespective of the distance between the DT and the saccade endpoint (h). Error bars show SEM, dashed and full lines represent nonsignificant (p > 0.05) and significant (p < 0.05) comparisons, respectively. See Supplementary Fig. S3 and Supplementary Table 2 for individual participant results.

