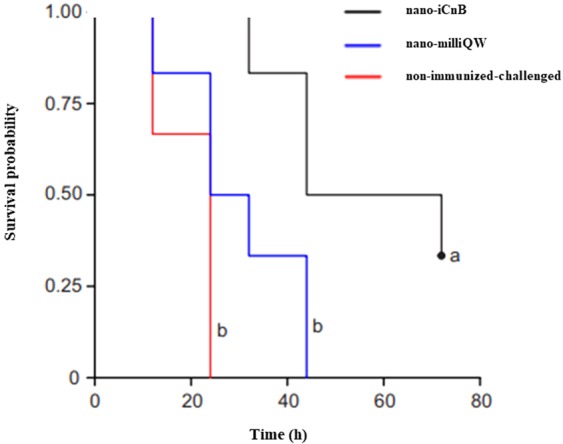
Figure 6.

Survival curves of Swiss mice of experimental groups using the Kaplan-Meier method. The LT50 of the non-immunized-challenged group of 20.0 (15.1–24.9), while the LT50s of nano-milliQW and nano-iCnB were 30.0 (19.9–40.1) and 56.0 (40.8–71.2), respectively. The log rank statistic for the survival curves showed a significant difference between survival curves (p = 0.002). The survival curves were compared to the curves of the three groups (nano-milliQW, non-immunized-challenged and nano-iCnB) simultaneously, using TL50 as the comparison unit. Only animals in the nano iCnB group showed significant differences.
