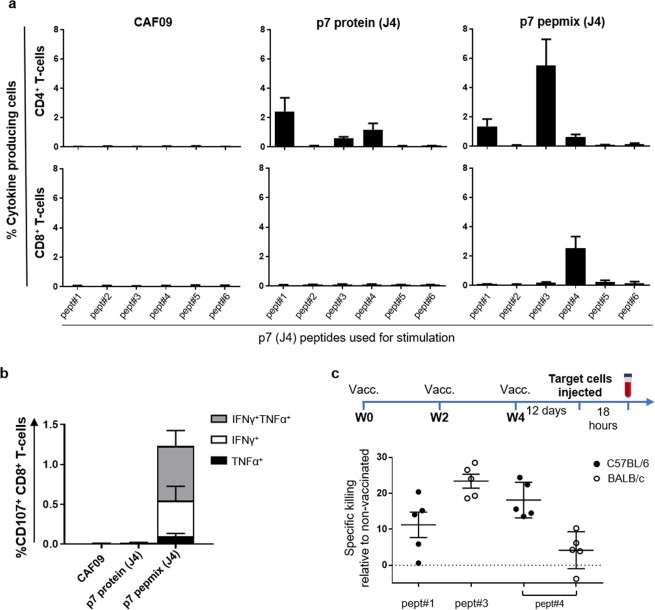
Figure 2.
Specific killing by cytotoxic CD4+ and CD8+ T-cells in vivo (a) Mice were vaccinated three times at 2-week intervals with HCV p7 protein or pepmix (strain J4) as indicated above the graphs. Splenocytes from individual mice were isolated two weeks after the final vaccination and re-stimulated with each of the individual peptides spanning the p7 (J4) sequence to map the repertoire of epitope-specific responses. The peptide# identifiers are indicated below the x-axis. Bars indicate the total frequency of epitope-specific CD44+ CD4+ T-cells (upper panels) and CD44+ CD8+ T-cells (lower panels) able to produce IFN-γ, TNF-α or IL-2 in any combination. Data are shown as means and SEM (n = 4 to 6 mice in each vaccine group). (b) Pept#4 (J4)-specific CD8+ T-cells were further assessed for their ability to co-express CD107 with IFN-γ and/or TNF-α. (c) CFSE-labelled target cells from naïve mice were pulsed with single p7 peptides #1, #3 or #4 or left untouched and subsequently injected i.v. into controls and p7 pepmix (J4) vaccinated C57BL/6 or BALB/c mice 12 days after the final immunization, as indicated on the timeline. Eighteen hours after i.v. injection, the remaining population of target cells in in controls or vaccinated mice were identified based on their CFSE-fluorescence and MHC-II expression (timeline). The graph shows percent specific killing of target cells pulsed with peptides #1, #3 or #4 in individual mice vaccinated with p7 pepmix relative to control mice. Means and SEM are indicated on the graph (n = 5 mice in each vaccine group).

