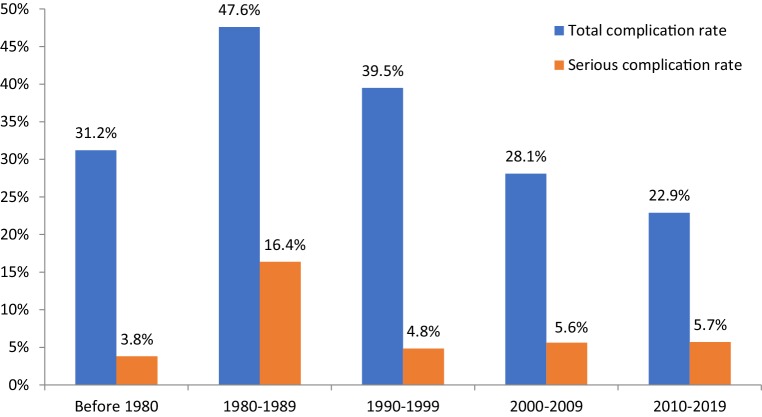
Fig. 2.
Bar chart demonstrating the complication rates (%) since the introduction of temporary transvenous pacing therapy in 1967. Ten-year intervals, based on year of publication, are shown on the x-axis. The total complication rate and serious complication rate are shown in percentages on the y-axis

