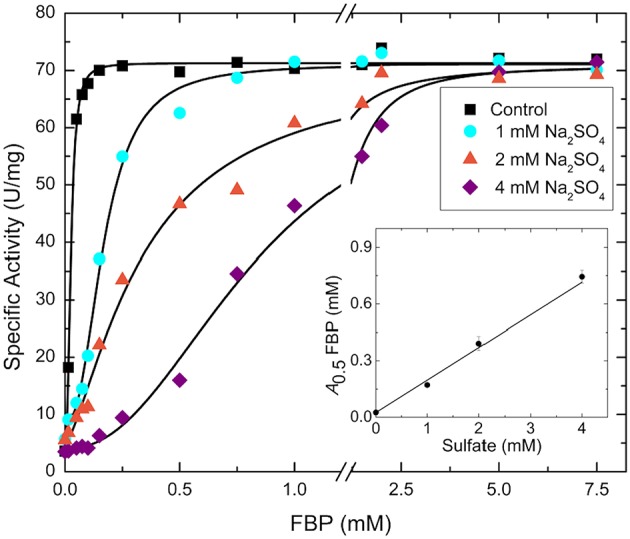
Figure 2.

FBP saturation curves for the WT E. coli ADP-Glc PPase in the presence of varying concentrations of sulfate. Activity was measured in the presence of 1.0 mM Glc1P, 1.0 mM ATP, 7 mM MgCl2, and 50 mM HEPES pH 7.5. The effector and sodium sulfate concentration were varied as indicated in the figure. The inset graph represents the linear trend between the calculated A0.5 of FBP from each curve and the concentration of sulfate.
