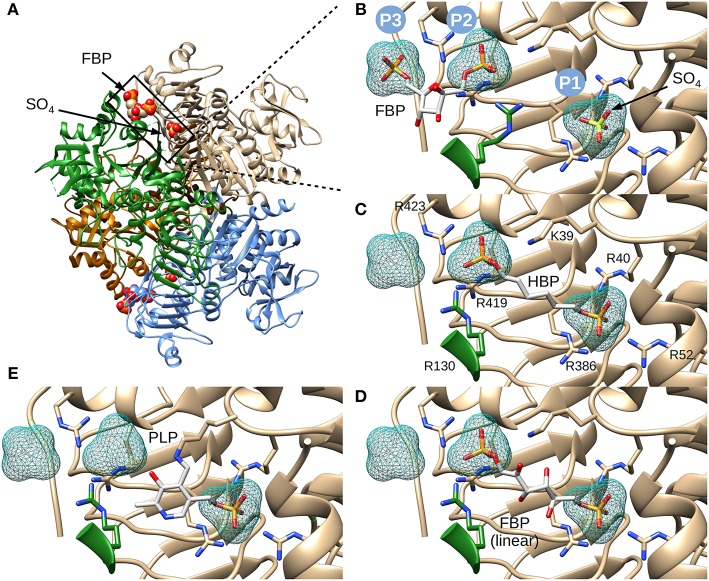
Figure 3.
Structure of E. coli ADP-Glc PPase and positioning of various ligands. (A) Ribbon representation of homotetrameric E. coli ADP-Glc PPase in the presence of FBP and sulfate (PDB ID: 5L6S). (B) Localization of the FBP-binding site. P1 shows the accessible surface area of the sulfate in 5L6S. P2 and P3 designate the accessible surface area of modeled phosphates equivalent to the phosphate groups of FBP from 5L6S. (C) HBP modeled into P1 and P2. (D) The linear form of FBP modeled into the putative FBP binding site comprising P1 and P2. The 1- and 6-phosphate groups were modeled into P2 and P1, respectively. (E) PLP modeled into the putative regulatory binding site, forming a Schiff base with Lys39 and the phosphoryl moiety at P1.

