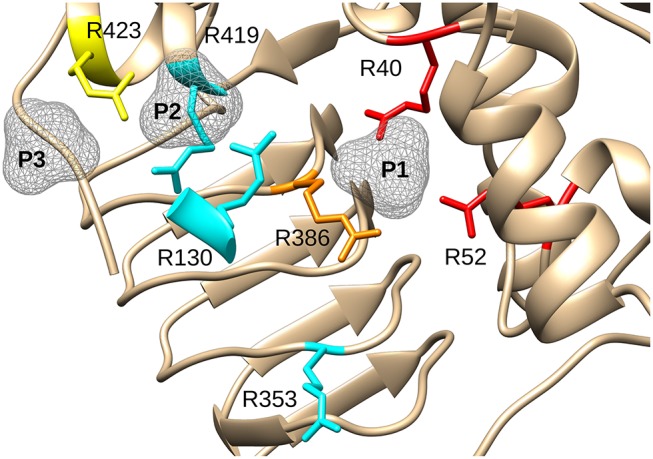
Figure 8.

Effect of mutagenesis on the allosterism of the E. coli ADP-Glc PPase. Arg residues depicted in the figure were mutated to Ala and characterized as described in the text. In red (Arg40, Arg52), are residues with negligible activation after mutagenesis. In orange (Arg386), is the residue that displayed a significantly lower apparent affinity for FBP and PLP (37- and 56-fold, respectively). In yellow (Arg423), is the residue that displayed a near WT maximum activation but had 12-fold lower apparent affinity for FBP and higher activity with PLP (only 2.6-lower apparent affinity). In cyan, are Arg residues that did not display dramatic effects on the allosteric activation when they were mutated to Ala. P1, P2, and P3 are surfaces depicting putative binding sites for phosphate groups.
