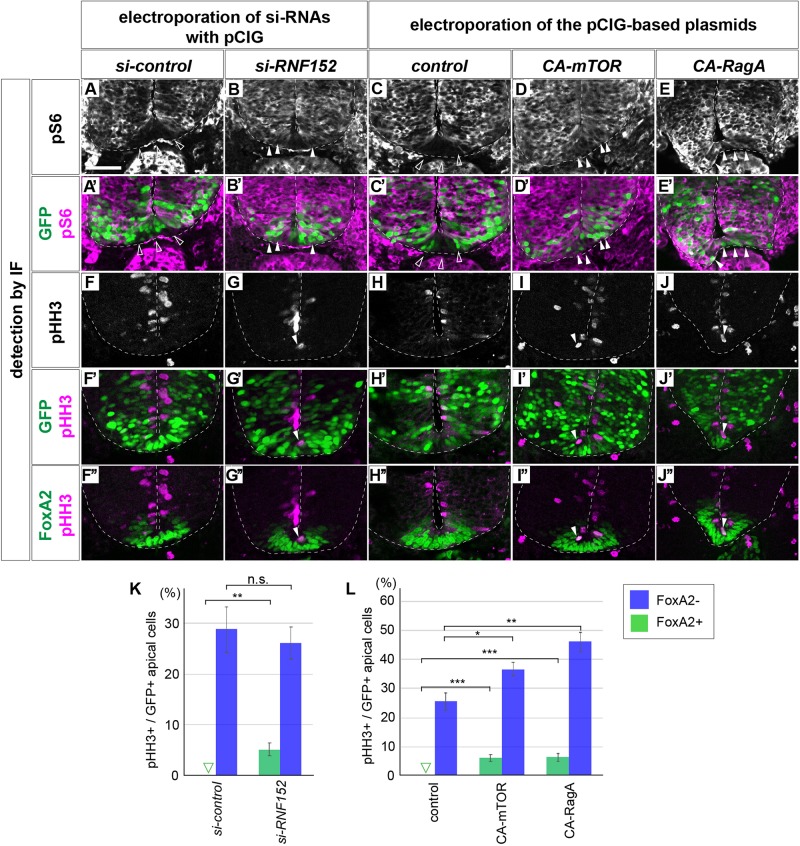
FIGURE 6.
Blocking RNF152 expression or activation of mTOR signal leads to aberrant pS6 upregulation and cell division in the floor plate. (A–B’,F–G”) Knockdown of RNF152 by si-RNA caused aberrant mTOR activation and the appearance of pHH3-positive cells. si-control (A,A’,F,F’,F”) or si-RNF152 (B,B’,G,G’,G”) were electroporated in the FP at HH stage 10 and embryos were analyzed at 48 hpt with pS6 (A–B’), pHH3 (F–G”), FoxA2 (F”,G”), and GFP (A’,B’,F’,G’) antibodies. (C–E’,H–J”) Activation of mTOR signal induces aberrant cell division. The plasmids of control pCIG (C,C’,H,H’,H”), CA-mTOR (D,D’,I,I’,I”), or CA-RagA (E,E’,J,J’,J”) was electroporated in the FP and analyzed with pS6 (C–E’), pHH3 (H–J”), FoxA2 (H”–J”), and GFP antibodies (C’,D’,E’,H’,I’,J’). The affected areas are indicated by filled arrowheads and outlined arrowheads. Scale bar = 50 μm. (K,L) Quantitative data for (F,F’,G,G’) in (K) and (H,H’,I,I’,J,J’) in (L). The pHH3-positive cells in FoxA2/GFP double-positive cells (FoxA2+) and in FoxA2-negative (FoxA2–)/GFP-positive cells in the apical domain were counted. The outlined triangles indicate zero (0). ∗p < 0.05, ∗∗p < 0.01, ∗∗∗p < 0.001.

