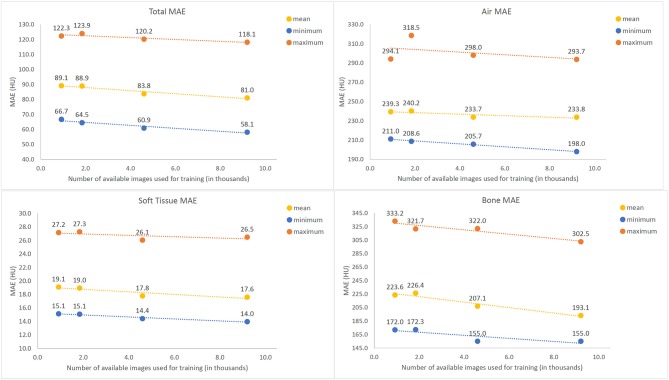
Figure 6.
Mean Absolute Error (MAE) values between Synthetic and actual CT image volumes as a function of amount of training data used, tested across 13 tested patients. The maximum (orange), mean (purple), and minimum (blue) values all demonstrate a gradual decreasing trend with increased numbers of training images.

