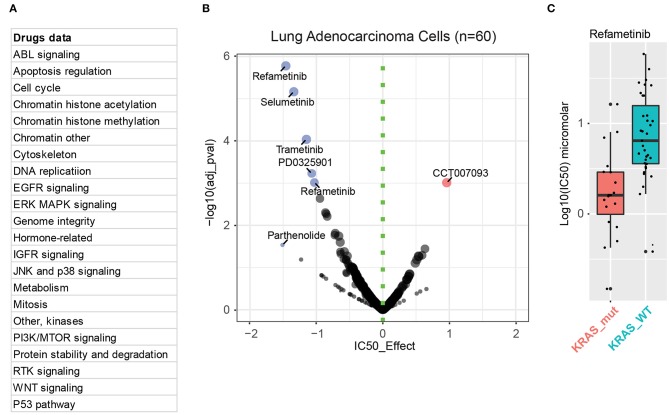
Figure 3.
MEK mediates the key downstream effect in KRAS-mutant lung cancer cells. (A) Drug information incorporated in the Genomics of Drug Sensitivity in Cancer database. (B) Integrative analysis of drug sensitivity data of KRAS-mutant (n = 20) lung adenocarcinoma cells compared to KRAS-wild-type (WT; n = 40) ones. In the volcano plot, the x-axis indicates the IC50 effect, with effect < 0 representing KRAS-mutation sensitive inhibitors (in blue) compared with KRAS-WT ones. The color intensity and the circle size are proportional to significance value (the y-axis). (C) Sensitivity analysis of KRAS-mutant (in red) and WT (in blue) cells to one of the MEK inhibitors, refametinib.

